
AI Talent Report
Executive summary
The number of graduates in the United States with AI-relevant technical training has risen in recent years along with major breakthroughs in AI. CEA investigates the capacity of the United States to meet the growing demand for AI talent. We begin by documenting the growing demand for AI talent and develop a classification system for categorizing AI-related postsecondary degrees into two relevant categories: AI software and AI hardware. Using this degree classification system, we explore the level and growth of the supply of graduates in AI-relevant degrees from U.S. institutions of higher education overall, and in comparison to other countries. We find that:
- The number of AI-relevant graduates (bachelor’s, master’s, and doctorate) in the United States has increased significantly in the last decade, driven by growth in BA and MA degrees.
- Non-U.S. citizens make up a significant share of graduates, with non-U.S. citizen PhD students making up nearly half of AI-relevant PhD graduates.
- Most AI-relevant PhD graduates from U.S. institutions are trained at public universities.
- Internationally, the United States produces more AI-relevant degree graduates than most countries, with the notable exceptions of India (which produces more AI-relevant BAs) and China (which produces both more relevant BAs and PhDs).
- The number of AI-relevant BA and PhD graduates is growing faster in China than in the United States.
- The United States still produces a larger share of top AI researchers and continues to be the world leader in housing top AI labs and producing frontier AI models.
- Demand for AI talent (to the limited extent we can assess it) appears to be growing at an even faster rate than the increasing supply of AI talent trained in U.S. colleges and universities.
- The United States could increase its supply of AI talent in three broad ways: 1) increasing the number of students training at U.S. institutions, 2) increasing post-graduate inflow of students trained abroad and reducing post-graduate outflow of students trained in the United States, and 3) providing incentives for capable workers to switch into AI sectors.
The report concludes by discussing policy interventions that could support these three paths to increasing the supply of AI talent.
Motivation
While Artificial Intelligence (AI) is still in its early stages of development, its rapid integration into everyday life has important economic implications, especially for productivity and competitiveness. The enormous potential of AI to shape critical infrastructure and technology also makes it a key focus of national security policy. At the most basic level, most of today’s advanced AI systems are produced by using computing power to train models by exposing them to large volumes of data. Discussions of the capacity of the United States to produce top-tier AI models usually focus on the domestic capacity to scale up the physical components of these inputs (like the production of semiconductors, the construction of datacenters, and the electricity provision to run them). However, human talent is also a core engine behind the growth of the AI sector. Highly-skilled workers develop the algorithms, implement the training of models on datasets, develop cutting-edge hardware, and operate the datacenters where AI systems are trained and run. The supply of AI talent—the human capital necessary for the production of AI systems—is therefore an important consideration when evaluating the domestic capacity of U.S. AI industry. This report examines the current production of AI talent in the United States to understand the degree to which the United States is poised to continue to lead in AI development and implementation.

In this report, CEA considers two classes of work that require AI talent. The first of these classes is the “software side:” the researchers who work directly on processes like creating and curating data, developing model architectures and creating algorithms to train, adapt and finetune models, and deploying the final product. This class includes machine learning engineers, software engineers, and research scientists working at companies like OpenAI or Google DeepMind that produce AI models. The second of these two classes is the “hardware side.” This is a broader category. CEA defines “AI hardware” work to include skilled work at all parts of the AI supply chain for computer hardware. Because this report is concerned with the capacity of the U.S. educational system to train eligible workers, CEA focuses on uniquely skilled work in these sectors to differentiate from work that does not require higher educational background or training.[1] This class includes work at different parts of the AI supply chain, including engineers and technicians in datacenters as well as semiconductor design, fabrication and assembly, testing, & packaging (ATP) facilities. The distinction between software and hardware is more complex than the simple grouping outlined here: engineers designing semiconductors are increasingly turning to AI to help optimize chip design, and hardware experts with an understanding of computer architectures[2] are often part of the teams building AI models.[3] While imperfect, CEA nonetheless considers these classes to be a useful proxy for the types of talent pools that the United States will need to supply to meet growing demand in the high-skilled AI sector.[4]
AI talent demand
We first consider the scale of demand for AI talent for both software and hardware.
Software
Demand from AI labs for top talent appears to be significant and increasing. AI labs training frontier AI models[5] spend about 29-49 percent of their total costs on labor—a non-trivial sum considering that total costs to train a single model can exceed $100 million.[6] Part of the large labor expense may be attributable to the fact that AI labs will frequently offer high salaries to attract top talent, which is borne out in the fact that salaries for AI talent are generally higher than for other computer science roles.[7] Not only are salaries high, but they have grown rapidly: a survey of AI professionals found that salaries increased between 10 and 13 percent between 2021 and 2022.
Further evidence of high demand comes from the growth in job listings focused on AI software-related skills. Figure 1 shows the annual number of jobs postings that list skill requirements like “natural language processing” and “neural networks.”[8] Between 2015 and 2023, the number of job listings requiring AI skills increased 257 percent (overall job listings during that time increased 52 percent).
Hardware
Because the hardware side of AI talent includes a variety of distinct sectors—including datacenters and the chips supply chain—quantifying the growth in AI hardware demand involves looking at demand across different markets. We first consider datacenters, which have experienced rapid growth in investment, much of which is tied to AI activity. The aggregate value of data center deals increased 40 percent from 2020 to 2021, to reach $48 billion in investment. The UptimeInstitute forecasts that labor demand will grow at a compound annual growth rate of around 3 percent, with most of the growth concentrated in cloud computing. The vast majority of jobs in datacenters require either training at a university/trade school or equivalent experience, and employers have struggled to find enough trained workers to meet their needs: 50 percent of surveyed data center managers in 2020 reported having difficulty finding skilled workers to fill positions, and 71 percent continued to report being concerned about finding qualified staff in 2023.
The semiconductor supply chain—also integral to implementation of AI systems—has similarly struggled to find skilled workers amid growing demand. The design and manufacturing of semiconductors requires technical expertise; more than half of workers in the industry have a graduate or bachelor’s degree.
To meet growing demand—from both datacenters and the chips supply chain—the United States will need to produce significantly more domestic talent, attract foreign talent, or repurpose capable American workers currently employed outside of AI-related fields.
A framework for understanding the supply of AI talent
At any given moment, a certain number of workers in the United States are contributing to the development and implementation of AI systems. However, this number is only fixed in the very short run. With time, there are three channels through which workers enter or exit what we will call the “AI sector:”
- By gaining the necessary skills at U.S. postsecondary institutions
- Through the immigration or emigration of AI-talent to and from the United States
- Via U.S. workers with AI-related training switching into and out of the AI sector
Much of this report focuses on understanding the first channel, and in particular the number of recent postsecondary degrees awarded in AI-related fields. However, the second and third channels are just as important, and CEA considers them to the extent possible with available data. Foreign-born students at U.S. institutions, and, to a lesser extent, native-born students, sometimes leave the United States after their education is completed. This detracts from the total supply of AI talent in the United States. Conversely, foreign-born individuals educated abroad often come to the United States and become part of the pool of available talent. These flows have substantial effects on the net pool of talent available in the United States to contribute to AI development.
The third and final channel is somewhat more subtle. Often, estimates and projections of labor supply in a given sector take as given the current number of workers who are employed in a given industry or occupation. But this can be misleading because workers can and do shift from industry to industry, and from occupation to occupation. Particularly when a sector is rapidly growing, as is the case with AI-related work, capable individuals are likely to be drawn in from other lines of work. For this reason, it is important to focus on the relevant training of a given individual—as best that can be measured—rather than the current occupation. This motivates our focus on education rather than occupation or industry.
AI Relevance classification system
To help quantify how well-equipped the United States is to meet the growing demand for AI talent, we develop a classification system of U.S. higher-education degrees that helps identify which recent graduates likely have the necessary skills to contribute to the AI sector. In turn, this allows us to estimate how many workers can help meet software and hardware-related AI labor demand.
We focus on educational field instead of occupation because we care about the pool of potential AI talent, rather than how it is currently distributed in the labor market. Someone with a technical background in machine learning, for instance, would have the necessary skills to work on AI, but may currently work in an unrelated field like finance. Market forces or public policy actions could shift such workers into AI-related roles. We also consider a selection of fields that is broader than the narrow subset of degrees directly tailored for AI, as we expect that measuring only the number of researchers trained in explicitly AI-focused fields would underestimate the U.S. supply of AI talent. For example, while only 205 “Artificial intelligence” PhDs were awarded in the United States in 2022—which would amount to a slim talent pool—many of the 1,484 recipients of “Computer science” PhDs in the same year would likely be able to provide software-side talent to AI firms (not to mention the thousands of other researchers in fields like mathematics).
Using 2022 data from the National Center for Education Statistics (NCES) Integrated Postsecondary Education Data System (IPEDS), which provides data on academic degrees awarded in the United States, we classify AI relevant degrees—undergraduate, masters, and doctorates—as falling into one of four relevance categories based on CEA’s assessment: directly relevant to AI software, indirectly relevant to AI software, directly relevant to AI hardware, or indirectly relevant to AI hardware. There is no pre-existing hardware/software degree classification of AI relevancy, so CEA constructed this classification system based on internal analysis of the fields and in consultation with industry experts. Of the 2,320 detailed academic fields included in the IPEDS systems, we classify 154 as AI-relevant.[9] Table 1 shows a sample of detailed IPEDS fields classified according to this system. For example, the IPEDS field of “Artificial Intelligence,” within the broader 2-digit category of “Computer and Information Sciences and Support Services,” is classified as directly relevant to hardware. Most of the four AI-relevancy designations contain fields from multiple 2-digit categories; fields from both Engineering and Physical Sciences categories are hardware-relevant, for example. We do not assume that all fields within one category have the same relevance. For example, the category of Engineering contains Chemical Engineering (directly hardware-relevant), Metallurgical Engineering (indirectly hardware-relevant), and Astronautical Engineering (irrelevant to both hardware and software). See Appendix C for the complete classification.
Table 1: AI relevance classification of example IPEDS fields.
The potentially broad scope of AI relevance
The AI relevance classification system, described above, is necessarily limited in scope. It aims to capture degrees that have relatively specific relevance to AI systems. What this classification excludes is much of the infrastructure—and the workers needed to build and sustain that infrastructure—that matters for deployment of AI systems, but is not specifically built for AI purposes.
Most notably, the electric power industry provides an essential and scarce input for AI computation. According to projections from the Lawrence Berkeley National Lab, data centers will account for between 6.7 and 12.0 percent of total U.S. electricity consumption by 2028, a significant increase from the 2023 share of 4.4 percent. This would require a commensurate increase in labor for the electrical power industry. From 2020 to 2024, this industry grew from 381,000 to 412,000 workers. The industry is expected to grow to 445,000 workers in 2033. Additionally, the number of workers in non-residential building construction—another adjacent industry that would need to scale—rose from 798,000 in 2020 to 923,000 in 2024, and is projected to grow to 936,000 in 2033. But scaling up will also require surmounting other challenges, as discussed in NEC (2025).
Any assessment of AI-relevant labor supply should acknowledge the important role of labor inputs to general-purpose infrastructure like electrical power and nonresidential building construction. However, it would not be appropriate to broaden the scope of the CEA’s AI-relevance classification so as to encompass workers with the relevant skills for those industries. While this would in a sense be more comprehensive, it would be a poor fit for the degree-based approach taken in this report.
Recent degree flows relevant to AI
Figure 2 shows the number of postsecondary degrees awarded in 2022 that are relevant to hardware or software. As noted above, the figure does not necessarily correspond to the current fields of work for the degree recipients. CEA finds that 41.9 percent of AI-relevant degrees awarded in the U.S. are in the area of engineering, 36.5 percent in computer and information sciences, 13.7 percent in mathematics and statistics, 4.0 percent in the physical sciences, and 3.9 percent in biological sciences, multidisciplinary subjects, and linguistics. Of all of these, 45.2 percent were deemed relevant to hardware-related AI work, and 54.8 percent relevant to software.
In turning to consider the domestic supply of talent, this report primarily focuses on postsecondary degrees (especially bachelor’s degree, master’s degrees (when available), and PhDs). This ignores the fact that many skilled workers—on both the software and hardware sides of AI—do not have postsecondary degrees requiring four or more years: OpenAI has notably hired researchers just out of high school, and datacenters are often willing to accept experience as a substitute for postsecondary degrees. CEA nonetheless considers data on these degrees to be the best available proxy for the relevant skills and aptitudes. This report also considers multiple degree types when the data is available—rather than just focusing on PhDs alone. Degrees at different education levels offer a sense of the number of workers along different stages of the talent pipeline.
Domestic talent
Supply vs. demand
Using the classification system discussed above, CEA finds that the number of AI-related bachelor’s degrees (BAs) awarded by U.S. postsecondary institutions has increased sharply since the late 2000s, more than doubling since 2010. See Figure 3. Computer science/Computer and informational sciences and Mechanical engineering degrees drove this increase, accounting for 42 and 13 percent of the total increase from 2010 to 2022, respectively.[10]
The number of master’s degrees has also risen, increasing by 71 percent over the same period. Although AI-related doctorates are a relatively small share of total AI-related degrees awarded, the number of PhDs awarded has grown by 48 percent since 2010. The rates of growth for AI-related BA and MA degrees have far outpaced overall growth in total degrees awarded in the U.S., while AI-related PhDs have grown slightly faster than the overall rate.[11]
How does this growth in supply of AI talent compare to the growth in demand? The ability to make such a comparison is limited by the available data: information about supply comes from degree awards, whereas information about demand comes from job postings for a subset of AI-related jobs and projections of demand for specific AI-related sectors. These supply and demand proxies are sufficiently different as to make their absolute levels not directly comparable. Moreover, we are unable to disaggregate the demand proxies by degree type or level. Still, it may be illuminating to juxtapose aggregate trends on the supply and demand sides of the market, focusing on growth in each proxy.
Growth in the supply of AI talent appears to lag growth in demand. In the AI software sector, the number of job postings for AI software-related positions grew at an average annual rate of 31.7 percent from 2015 to 2022. By contrast, the average annual growth rate of AI software-relevant degrees over the same period was only 8.2 percent for bachelor’s degrees, 8.5 percent for master’s degrees, and 2.9 percent for PhDs. In the hardware sector, estimated demands for workers in datacenters are projected to grow at a rate of 3 percent. As with the software sector, this growth exceeds recent supply increases: between 2015 and 2022, the average annual growth rate of AI hardware-relevant degrees was 2.7 percent for bachelor’s degrees, -0.3 percent for master’s degrees, and 1.5 percent for PhDs.
Characteristics of the U.S. talent supply
Although we cannot observe the share of U.S. graduates who subsequently enter the U.S. labor market, we can use citizenship and nationality as a helpful indicator. Below, we explore the share of U.S. degree holders who are non-U.S. citizens and how this has evolved over time as a way to better understand how many of these AI-related degree-holders are likely to remain in the U.S. labor market.
Figure 4 shows degrees awarded to non-U.S. citizens, broken out by hardware/software classification within AI-relevant degree fields. Only a small minority of AI-related BAs (panel 4a) are awarded to non-U.S. citizens (11 percent in 2022), but this pattern does not hold for post-baccalaureate degrees. Between 40 percent and 60 percent of AI-related master’s degrees have been awarded to non-U.S. citizens in the last 5 years (panel 4b). For PhDs (panel 4c) this share has been above 50 percent since 2003, most recently 59 percent in 2022. This is considerably higher than the share of PhDs awarded to non-U.S. citizens in other subjects, which has hovered around 20 percent since the early 2000s.
Finally, it is important to note that federal funding to public universities is currently supporting a large share of the bachelor’s and post-baccalaureate (MAs and PhDs) degrees that are related to AI (see Figure 5). Public universities in the United States produce a disproportionate share of AI-related PhDs and, to a lesser extent, BAs relative to non-AI related degrees. 73 percent of AI-related BAs, 58 percent of MAs, and 71 percent of PhDs in 2022 were awarded by public institutions (panels 5a, 5b and 5c). This compares to 65 percent of non-AI BAs, 46 percent of non-AI MAs, and 55 percent of non-AI PhDs as publics.
Two findings stand out in these analyses of the supply of AI talent. First, non-U.S. citizens are a significant source of potentially available talent, especially in master’s and doctorate degrees earned at U.S. institutions of higher education. Roughly half of AI-relevant master’s degrees awarded in the United States, and more than half of doctorates, are earned by non-U.S. citizens. Whether or not these researchers remain in the United States after completing their degrees will be a significant factor in determining the ultimate supply of AI talent working in the United States, as we discuss below. Second, graduates from public universities make up the majority of graduates with AI-relevant degrees, suggesting that federal and state investments in higher education have the potential to shape the capacity of public institutions to expand these AI-related degree programs.
International comparisons
Motivation
How does the United States compare to other countries with respect to the production of AI-related degrees? This is important for a few reasons. First, the supply chain for AI is highly globalized, and the talent pool for AI is no exception—top researchers come from around the globe. International researchers make up a significant fraction of AI-related graduates from U.S. universities, especially among PhD graduates. Moreover, we ultimately care about the pool of post-graduate researchers—not where researchers got their degree—and thus need to understand how many researchers leave the United States after completing a degree domestically (outflows) and how many enter the United States after completing a degree abroad (inflows). Lastly, in the increasingly competitive space of frontier AI development, it’s valuable to understand how a critical input—AI talent—compares across nations, particularly in light of considerations of national security and the potential risks posed by AI.
It is important to note that the United States can benefit from AI development that occurs abroad. International cooperation and competition in building AI systems both hold the promise of faster technological progress and economic growth at a global scale. National security concerns—the gravity of which is outside the scope of this analysis—weigh in favor of U.S. leadership. But scientific and technological progress are ultimately public goods that yield rising living standards over time.
Data considerations
Ideally, we’d apply our AI Relevance classification to the education data of other countries and directly compare the supply of AI talent across different categories of AI relevance. Unfortunately, there is not readily available international data at the level of granularity of the U.S. IPEDS system (for example, China only provides data at the level of broad classifications like “science,” rather than classifications analogous to IPEDS like “computer science” or “electrical engineering”).[12] Instead, we use the narrowest common category available in most international education data, which is a category for “science”[13] and a category for “engineering.” Commonly, international comparisons of this sort use STEM as the broad proxy. We opt to use the narrower “science and engineering” (S&E) grouping to eliminate categories typically included in the STEM designation that are clearly not relevant to AI, like agriculture and medicine.[14]
How good of a proxy is the S&E grouping for the fields that are actually relevant to AI talent? CEA cannot directly answer this question for international data, for which there is not any information more detailed than the categories of Science and Engineering. However, one can apply the S&E classification system to the highly granular U.S. IPEDS data, and see how well it matches up with the more accurate AI Relevance classification. CEA finds that about one third of graduates in the S&E categorization would fall outside of our more granular AI-relevant degree classification system, and less than five percent of AI-relevant graduates are not included in the S&E categorization.[15] CEA considers this to warrant sufficient overlap between the two classification systems, such that it is reasonable to proceed with international comparisons using S&E. See Appendix A.
Top S&E producing countries
Equipped with the S&E measure, for which most relevant countries provide yearly data, we compare the United States to China, India, and top-producing OECD countries. Figure 6 shows the distribution of bachelor’s and doctorate degrees[16] awarded in science and engineering across these top-producing countries. Note that we are comparing data from the Chinese Ministry of Education, the Indian Ministry of Education, IPEDS, and OECD. These comparisons are not perfect, since any source may define “Science” or “Engineering” somewhat differently, and may have different criteria for what is counted as a doctorate degree. This is evidenced by the fact that the supply of U.S. S&E graduates varies depending on whether one is looking at IPEDS or OECD data; both are shown in Figure 6.
One can observe a few things from this figure. First, while the United States produces more relevant degrees than most countries, it is not the leader. India produces more relevant BAs, and China produces more BAs and PhDs than than the United States. Among PhDs, China produces signficantly more AI-relevant PhDs than the United States, awarding between 1.5 and two times the number of PhDs the United States awards (depending on which measure one uses for the United States).
Second, the overall population of a country plays a significant role. The dominance of countries like the United States, and, in particular, China and India, is largely a function of population. Countries like China, India, and the United States produce fewer S&E graduates per capita than smaller countries like the UK and Australia, but nonetheless produce more graduates overall. See Figure 7.
This pattern is born out to some extent in the fact that countries like China, India, and Brazil rank relatively higher when comparing BAs instead of PhDs, since a higher share of the population will receive BAs than PhDs. Overall, while per capita values may speak to the robustness of postsecondary institutions in a country, total numbers of graduates are likely more relevant to questions of international competitiveness and leadership in the AI space.
China and the United States
We now focus directly on comparisons between the United States and China. We also include graduation rates from India for comparison. Figure 8a shows recent numbers of bachelor’s degrees in science and engineering, where China produces dramatically more S&E graduates than the United States. For example, in 2022 China awarded nearly six times as many bachelor’s degrees in science and engineering fields—a proportion above China’s population multiple (relative to the United States) of 4.2.
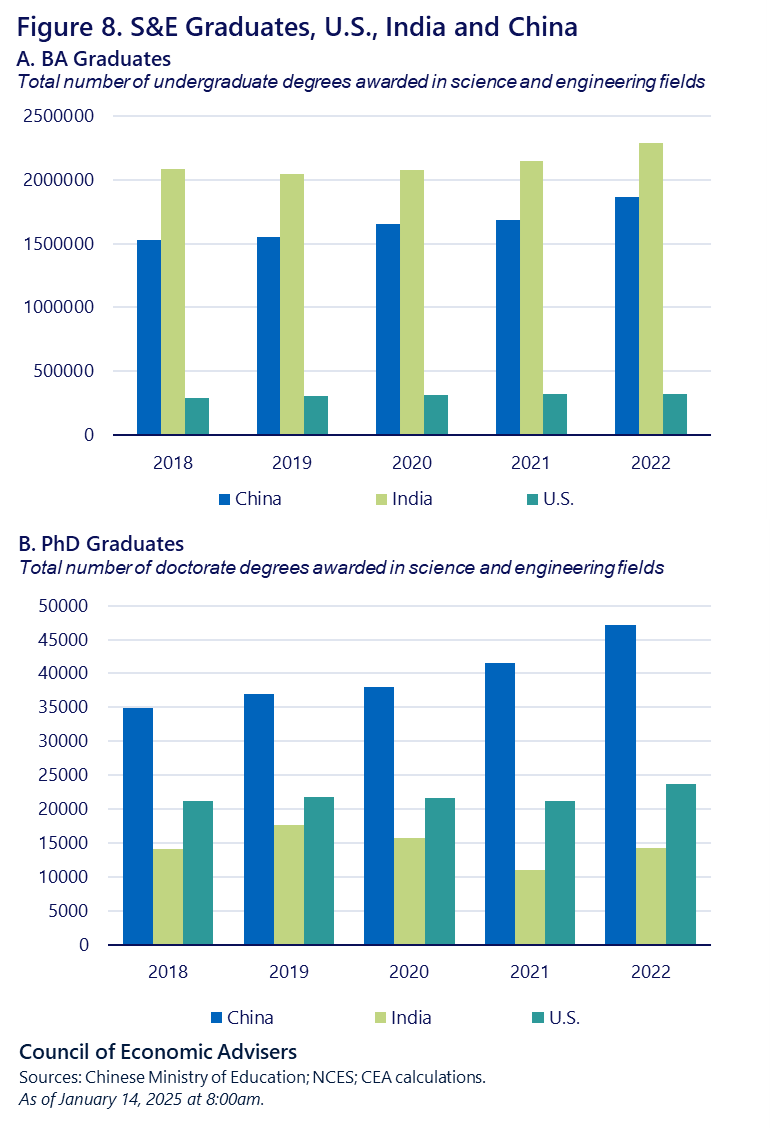
If we consider PhD graduates, instead of BAs, China’s lead on the United States is less sizable, though still substantial (Figure 8b).[17] Not only is China producing more S&E PhDs than the United States, but the gap is widening. In 2018, China produced 65 percent more S&E PhDs than the United States. In 2022, China produced 99 percent more S&E PhDs than the United States—nearly double. While China has awarded an increasing number of PhDs each year, the number of PhDs awarded by the United States has stayed relatively flat, as evident in Figure 8b.
While graduation data do not indicate in which country researchers ultimately work, other data sources that include work location are illuminating. In 2019, 59 percent of top AI researchers—as determined by those whose papers were selected for the highly prestigious NeurIPS machine learning conference—worked in U.S. companies, compared to only 11 percent in Chinese companies.[18] By 2022, only 42 percent of top AI researchers worked in U.S. companies and the Chinese share had grown to 28 percent.[19] The growth in Chinese top AI talent is driven to some degree by the recent proliferation of top-tier AI labs in China: in 2019, only two of the 25 most prolific AI research institutions (as determined by production of prestigious AI authorships) were in China; by 2022, six of the top 25 institutions were in China. During that same time, the number of top institutions in the United States fell from 18 to 15.
Talent flows
Measuring where AI-relevant PhDs are awarded is essential for understanding the supply of U.S. talent, given that most U.S. graduates ultimately work in the U.S. labor market. However, what we more precisely care about is not where someone receives their PhD, but where they choose to work after their PhD. This is particularly important for the United States, given that it features a world-class university system drawing students from around the world. Around half of U.S. S&E PhDs are awarded to non-U.S. citizens, and not all of these researchers will choose to stay in the U.S. after their PhD. While we don’t have specific data on the number of non-citizen S&E PhDs in China as we do for the United States, we do have estimates of how many researchers from a select sample stay in the United States or China after completing a degree in each respective country. Researchers from Macro Polo at the Paulson Institute analyzed the backgrounds of the top researchers at a prestigious machine learning conference to estimate the flows of talent across countries. While tracking flows of researchers at machine learning conferences is far from a perfect proxy for science and engineering PhDs overall, it likely gives a reasonable sense of scale (and may correspond more closely to AI relevance).[20]
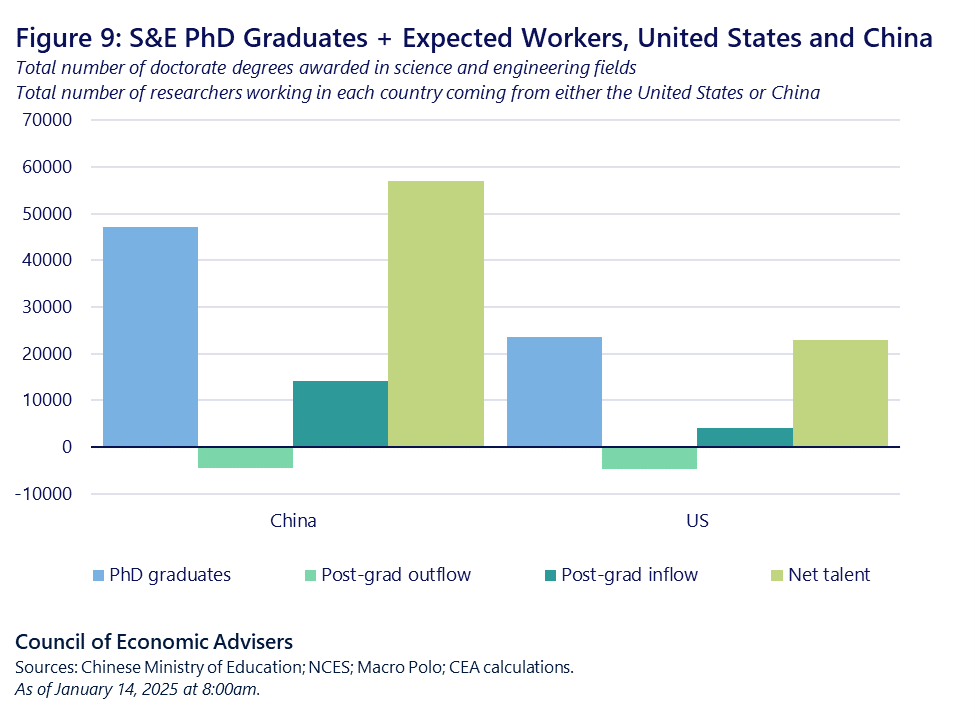
Using this data, we can predict how many researchers will end up working in both countries by combining this with our data on Science and Engineering PhDs. Of the students graduating from PhD programs in the United States and China, some will leave the the country to work elsewhere (mostly to China or the United States, respectively). This detracts from the net talent pool remaining in the country. Supplementing the net talent pool, however, are the post-graduates who enter a country after completing a PhD abroad. China’s notably large rate of inflow is driven by the large share of students who did their bachelor’s in China, a PhD in the United States, and then return to China to work.
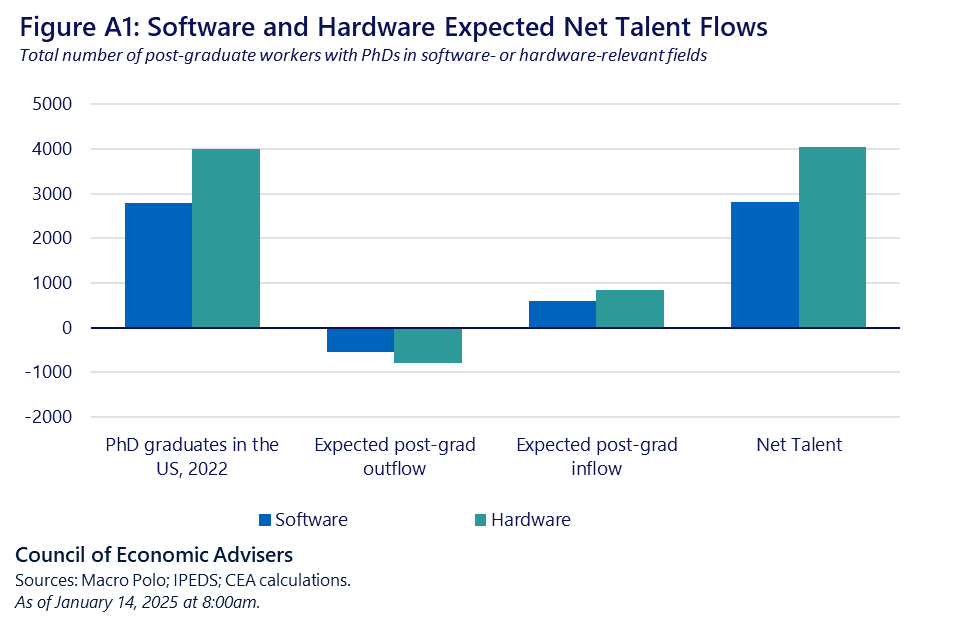
We can get an even more detailed picture if we look just at the United States. Focusing specifically on AI-relevant PhDs (rather than S&E PhDs broadly), we can estimate the expected net flows of AI talent within the United States alone by combining the same Macro Polo data with our estimates of AI PhDs based on IPEDS data. Appendix B shows the results of this analysis. Interestingly, post-grad outflows and inflows balance nearly exactly. The United States exports a significant amount of AI talent by providing top-tier AI-relevant PhD programs which attract international students, many of whom will return to their home countries post-PhD. Conversely, the United States offers attractive post-PhD employment opportunities, leading to imports of AI talent. These effects appear to roughly balance.
Quantity vs. quality
The quality as well as quantity of AI-talent supply matters for the competitiveness of U.S. AI firms. Not all graduates are equally equipped to supply AI talent. This discrepancy could come from a number of factors, including how selective an academic program is and the instructional resources available to a particular university. For the purposes of evaluating the actual supply of AI talent, the aptitude of graduates matters in addition to the raw number.
Comparing aptitude is difficult: there are no international standardized tests of AI-relevant ability from which one could gauge what share of graduates are able to work in the AI sector. However, there are some indications that the United States stacks up well against other countries, including those, like China, that the United States lags behind in quantity.
First, while China produces nearly double the number of S&E PhDs compared to the United States, the U.S. produces 90 percent[21] more top AI PhD researchers.[22] This may indicate that, while the United States produces fewer total researchers, U.S. graduates are more equipped to work in the high-skill AI sector.
Second, and perhaps related to the above finding that top AI researchers are more likely to work in the U.S., the United States is still dominant in terms of practical output. Most of the top AI labs are still based in the United States[23], most notable machine learning models and foundation models are still trained in the United States, and even most AI-related GitHub projects are U.S.-based. Again, this may indicate that, despite having fewer total researchers, the United States has an overall more talented workforce.
It’s worth noting that along all of these metrics—production of top AI researchers, number of top AI labs, and number of large-scale models trained—while the United States currently leads, that lead should not be taken for granted.
Policy considerations
A variety of public policy levers affect the total availability of workers in the United States who can contribute to AI development. CEA organizes these into the same three categories described above: policies affecting U.S. degree awards, policies affecting the net inflow of AI talent to the U.S., and policies affecting the allocation of capable U.S. workers to AI-related work.
Efforts to expand the number of post-secondary students who earn degrees that would prepare them to work in the AI sector could take a range of forms. Policies to increase college enrollment and completion overall would broaden the pool of students who might choose to pursue these AI-relevant degrees. Some universities limit the number of spaces available in degree programs that are AI-relevant or have more student interest that they can serve. Expanding AI-relevant degree program capacity would help to loosen these supply-side constraints. These efforts could benefit from increased investments in building faculty capacity and other instructional resources and providing financial and other supports to students in these fields. The public and private sector could also coordinate with universities to provide students with more information about growing employment opportunities and the wage-earning potential of AI jobs. This type of information intervention, when well designed, can help to steer students towards AI-related degrees.
The second category includes a variety of policies, the most important of which is likely U.S. immigration policy. The United States has long featured a dynamic labor market that rewards talented workers with in-demand skills, as in this case. But immigration obstacles often prevent capable workers—including many graduates of U.S. institutions—from moving to or staying in the United States and supplying their talents in the U.S. workforce. Among non-U.S. citizen AI PhDs who left the United States, over half cited immigration issues as relevant to their decision to leave. Furthermore, the immigration barriers in the United States appear to be higher than in many other countries that attract talent: 60 percent of non-U.S. citizen AI PhDs in the United States report immigration difficulties, while only 12 percent of non-citizen AI PhDs in other countries report similar issues. Making it easier for foreign researchers and AI professionals to work in the United States would likely both lower post-grad outflow, by allowing them to stay in the United States after completing their degrees, and increase post-grad inflow, by making it more attractive for researchers who are educated outside the United States to come to the United States for work. Targeted immigration reform measures could help increase the supply of top talent in the United States.
The third category of policy includes efforts to promote AI development, either by subsidizing work on AI or removing any policy impediments to its development. For example, the National Science Foundation funds research on safe AI development and has launched the National Artificial Intelligence Research Resource pilot to provide AI researchers with better access to needed computing resources. These investments help to draw capable students and workers into AI-relevant fields of work. This type of policy will also help make the United States a more attractive destination for capable foreign workers.
APPENDIX A. Data considerations for comparisons of U.S. and non-U.S. degree awards
First, since even the least granular (two-digit) classification structure of IPEDS is more granular than the broad categories of Science and Engineering, we must try to determine which two-digit groupings of educational fields would likely be in included in “Science” or “Engineering” categories if the United States were to provide only those coarse groupings (as countries like China or India do). We choose six two-digit categories[24] that seem likely to be similar to what a country like China would include in their broad Science and Engineering categories. We exclude categories related to fields like medicine, since most countries have a separate delineation for medical- or health-related fields.
Next, we can check how well this simple S&E grouping maps to the likely-more-accurate IPEDS-based AI Relevance classification by seeing how many six-digit fields in the Science and Engineering categories, as determined above, are relevant according to the AI Relevance classification.
The S&E category includes almost all AI-relevant fields, with the exceptions of 15 fields in Languages/Linguistics, Biological/Biomedical Sciences, and Multidisciplinary studies. These fields amount to only about 4 percent of 2022 AI-relevant graduates, so we are not particularly concerned with false negatives in the S&E category. Since the S&E grouping includes many more fields than the AI Relevance classification, we are more concerned with false positives (i.e., including categories in AI that don’t belong).
In the broad Engineering category, 46 of 118 fields (39 percent) that would likely be included in an Engineering category by countries like China are probably irrelevant for AI talent; this includes engineering fields like “Transportation and Highway Engineering,” “Forest Engineering” and “Agricultural Engineering.” In the Science category, 45 out of 95 fields (47 percent) are likely irrelevant, including fields like “Meteorology,” “Paleontology,” and “Acoustics.” However, when considering the total number of graduates from AI-irrelevant fields, the shares are considerably smaller: 33 percent of graduates from Engineering PhDs and 31 of graduates from Science PhDs are in AI-irrelevant fields. We consider this to represent sufficiently few AI-irrelevant education gradates that we feel comfortable comparing the U.S. supply of AI talent to international supplies.
APPENDIX B: Net talent flows in the United States
APPENDIX C: Full AI Relevance Classification
Below is the complete rating of IPEDS fields deemed relevant. The key for the AI Relevance rating is the following:
| 1 | Directly relevant to AI software |
| 1.5 | Indirectly relevant to AI software |
| 2 | Directly relevant to hardware |
| 2.5 | Indirectly relevant to AI hardware |
| 2-digit | IPEDS Category | IPEDS Title | CIP Code | AI Relevance |
| 11 | COMPUTER AND INFORMATION SCIENCES AND SUPPORT SERVICES. | Computer and Information Sciences, General. | 11.0101 | 1 |
| 11 | COMPUTER AND INFORMATION SCIENCES AND SUPPORT SERVICES. | Artificial Intelligence. | 11.0102 | 1 |
| 11 | COMPUTER AND INFORMATION SCIENCES AND SUPPORT SERVICES. | Computer and Information Sciences, Other. | 11.0199 | 1 |
| 11 | COMPUTER AND INFORMATION SCIENCES AND SUPPORT SERVICES. | Computer Programming/Programmer, General. | 11.0201 | 1 |
| 11 | COMPUTER AND INFORMATION SCIENCES AND SUPPORT SERVICES. | Computer Programming, Specific Applications. | 11.0202 | 1 |
| 11 | COMPUTER AND INFORMATION SCIENCES AND SUPPORT SERVICES. | Computer Game Programming. | 11.0204 | 1 |
| 11 | COMPUTER AND INFORMATION SCIENCES AND SUPPORT SERVICES. | Computer Programming, Specific Platforms. | 11.0205 | 1 |
| 11 | COMPUTER AND INFORMATION SCIENCES AND SUPPORT SERVICES. | Computer Programming, Other. | 11.0299 | 1 |
| 11 | COMPUTER AND INFORMATION SCIENCES AND SUPPORT SERVICES. | Data Processing and Data Processing Technology/Technician. | 11.0301 | 1 |
| 11 | COMPUTER AND INFORMATION SCIENCES AND SUPPORT SERVICES. | Information Science/Studies. | 11.0401 | 1 |
| 11 | COMPUTER AND INFORMATION SCIENCES AND SUPPORT SERVICES. | Computer Systems Analysis/Analyst. | 11.0501 | 1 |
| 11 | COMPUTER AND INFORMATION SCIENCES AND SUPPORT SERVICES. | Computer Science. | 11.0701 | 1 |
| 11 | COMPUTER AND INFORMATION SCIENCES AND SUPPORT SERVICES. | Data Modeling/Warehousing and Database Administration. | 11.0802 | 1 |
| 11 | COMPUTER AND INFORMATION SCIENCES AND SUPPORT SERVICES. | Modeling, Virtual Environments and Simulation. | 11.0804 | 1 |
| 11 | COMPUTER AND INFORMATION SCIENCES AND SUPPORT SERVICES. | Computer Software and Media Applications, Other. | 11.0899 | 1 |
| 11 | COMPUTER AND INFORMATION SCIENCES AND SUPPORT SERVICES. | Cloud Computing. | 11.0902 | 1 |
| 14 | ENGINEERING. | Chemical Engineering. | 14.0701 | 2 |
| 14 | ENGINEERING. | Chemical Engineering, Other. | 14.0799 | 2 |
| 14 | ENGINEERING. | Computer Engineering, General. | 14.0901 | 2 |
| 14 | ENGINEERING. | Computer Hardware Engineering. | 14.0902 | 2 |
| 14 | ENGINEERING. | Computer Software Engineering. | 14.0903 | 2 |
| 14 | ENGINEERING. | Computer Engineering, Other. | 14.0999 | 2 |
| 14 | ENGINEERING. | Electrical and Electronics Engineering. | 14.1001 | 2 |
| 14 | ENGINEERING. | Laser and Optical Engineering. | 14.1003 | 2 |
| 14 | ENGINEERING. | Telecommunications Engineering. | 14.1004 | 2 |
| 14 | ENGINEERING. | Electrical, Electronics, and Communications Engineering, Other. | 14.1099 | 2 |
| 14 | ENGINEERING. | Engineering Mechanics. | 14.1101 | 2.5 |
| 14 | ENGINEERING. | Engineering Physics/Applied Physics. | 14.1201 | 2.5 |
| 14 | ENGINEERING. | Engineering Science. | 14.1301 | 2.5 |
| 14 | ENGINEERING. | Materials Engineering. | 14.1801 | 2.5 |
| 14 | ENGINEERING. | Mechanical Engineering. | 14.1901 | 2.5 |
| 14 | ENGINEERING. | Metallurgical Engineering. | 14.2001 | 2.5 |
| 14 | ENGINEERING. | Systems Engineering. | 14.2701 | 2.5 |
| 14 | ENGINEERING. | Industrial Engineering. | 14.3501 | 2.5 |
| 14 | ENGINEERING. | Manufacturing Engineering. | 14.3601 | 2.5 |
| 14 | ENGINEERING. | Operations Research. | 14.3701 | 1.5 |
| 14 | ENGINEERING. | Electromechanical Engineering. | 14.4101 | 2 |
| 14 | ENGINEERING. | Mechatronics, Robotics, and Automation Engineering. | 14.4201 | 1 |
| 14 | ENGINEERING. | Engineering Chemistry. | 14.4401 | 2 |
| 14 | ENGINEERING. | Electrical and Computer Engineering. | 14.4701 | 2 |
| 15 | ENGINEERING/ENGINEERING-RELATED TECHNOLOGIES/TECHNICIANS. | Applied Engineering Technologies/Technicians. | 15.0001 | 2.5 |
| 15 | ENGINEERING/ENGINEERING-RELATED TECHNOLOGIES/TECHNICIANS. | Electrical, Electronic, and Communications Engineering Technology/Technician. | 15.0303 | 2.5 |
| 15 | ENGINEERING/ENGINEERING-RELATED TECHNOLOGIES/TECHNICIANS. | Laser and Optical Technology/Technician. | 15.0304 | 2.5 |
| 15 | ENGINEERING/ENGINEERING-RELATED TECHNOLOGIES/TECHNICIANS. | Telecommunications Technology/Technician. | 15.0305 | 2.5 |
| 15 | ENGINEERING/ENGINEERING-RELATED TECHNOLOGIES/TECHNICIANS. | Integrated Circuit Design Technology/Technician. | 15.0306 | 2.5 |
| 15 | ENGINEERING/ENGINEERING-RELATED TECHNOLOGIES/TECHNICIANS. | Audio Engineering Technology/Technician. | 15.0307 | 2.5 |
| 15 | ENGINEERING/ENGINEERING-RELATED TECHNOLOGIES/TECHNICIANS. | Electrical/Electronic Engineering Technologies/Technicians, Other. | 15.0399 | 2.5 |
| 15 | ENGINEERING/ENGINEERING-RELATED TECHNOLOGIES/TECHNICIANS. | Biomedical Technology/Technician. | 15.0401 | 2.5 |
| 15 | ENGINEERING/ENGINEERING-RELATED TECHNOLOGIES/TECHNICIANS. | Electromechanical/Electromechanical Engineering Technology/Technician. | 15.0403 | 2.5 |
| 15 | ENGINEERING/ENGINEERING-RELATED TECHNOLOGIES/TECHNICIANS. | Instrumentation Technology/Technician. | 15.0404 | 2.5 |
| 15 | ENGINEERING/ENGINEERING-RELATED TECHNOLOGIES/TECHNICIANS. | Robotics Technology/Technician. | 15.0405 | 2.5 |
| 15 | ENGINEERING/ENGINEERING-RELATED TECHNOLOGIES/TECHNICIANS. | Automation Engineer Technology/Technician. | 15.0406 | 2.5 |
| 15 | ENGINEERING/ENGINEERING-RELATED TECHNOLOGIES/TECHNICIANS. | Mechatronics, Robotics, and Automation Engineering Technology/Technician. | 15.0407 | 2.5 |
| 15 | ENGINEERING/ENGINEERING-RELATED TECHNOLOGIES/TECHNICIANS. | Electromechanical Technologies/Technicians, Other. | 15.0499 | 2.5 |
| 15 | ENGINEERING/ENGINEERING-RELATED TECHNOLOGIES/TECHNICIANS. | Energy Management and Systems Technology/Technician. | 15.0503 | 2.5 |
| 15 | ENGINEERING/ENGINEERING-RELATED TECHNOLOGIES/TECHNICIANS. | Solar Energy Technology/Technician. | 15.0505 | 2.5 |
| 15 | ENGINEERING/ENGINEERING-RELATED TECHNOLOGIES/TECHNICIANS. | Plastics and Polymer Engineering Technology/Technician. | 15.0607 | 2.5 |
| 15 | ENGINEERING/ENGINEERING-RELATED TECHNOLOGIES/TECHNICIANS. | Metallurgical Technology/Technician. | 15.0611 | 2.5 |
| 15 | ENGINEERING/ENGINEERING-RELATED TECHNOLOGIES/TECHNICIANS. | Industrial Technology/Technician. | 15.0612 | 2.5 |
| 15 | ENGINEERING/ENGINEERING-RELATED TECHNOLOGIES/TECHNICIANS. | Manufacturing Engineering Technology/Technician. | 15.0613 | 2.5 |
| 15 | ENGINEERING/ENGINEERING-RELATED TECHNOLOGIES/TECHNICIANS. | Welding Engineering Technology/Technician. | 15.0614 | 2.5 |
| 15 | ENGINEERING/ENGINEERING-RELATED TECHNOLOGIES/TECHNICIANS. | Chemical Engineering Technology/Technician. | 15.0615 | 2.5 |
| 15 | ENGINEERING/ENGINEERING-RELATED TECHNOLOGIES/TECHNICIANS. | Semiconductor Manufacturing Technology/Technician. | 15.0616 | 2 |
| 15 | ENGINEERING/ENGINEERING-RELATED TECHNOLOGIES/TECHNICIANS. | Composite Materials Technology/Technician. | 15.0617 | 2.5 |
| 15 | ENGINEERING/ENGINEERING-RELATED TECHNOLOGIES/TECHNICIANS. | Industrial Production Technologies/Technicians, Other. | 15.0699 | 2.5 |
| 15 | ENGINEERING/ENGINEERING-RELATED TECHNOLOGIES/TECHNICIANS. | Occupational Safety and Health Technology/Technician. | 15.0701 | 2.5 |
| 15 | ENGINEERING/ENGINEERING-RELATED TECHNOLOGIES/TECHNICIANS. | Quality Control Technology/Technician. | 15.0702 | 2.5 |
| 15 | ENGINEERING/ENGINEERING-RELATED TECHNOLOGIES/TECHNICIANS. | Industrial Safety Technology/Technician. | 15.0703 | 2.5 |
| 15 | ENGINEERING/ENGINEERING-RELATED TECHNOLOGIES/TECHNICIANS. | Hazardous Materials Information Systems Technology/Technician. | 15.0704 | 2.5 |
| 15 | ENGINEERING/ENGINEERING-RELATED TECHNOLOGIES/TECHNICIANS. | Process Safety Technology/Technician. | 15.0705 | 2.5 |
| 15 | ENGINEERING/ENGINEERING-RELATED TECHNOLOGIES/TECHNICIANS. | Quality Control and Safety Technologies/Technicians, Other. | 15.0799 | 2.5 |
| 15 | ENGINEERING/ENGINEERING-RELATED TECHNOLOGIES/TECHNICIANS. | Aeronautical/Aerospace Engineering Technology/Technician. | 15.0801 | 2.5 |
| 15 | ENGINEERING/ENGINEERING-RELATED TECHNOLOGIES/TECHNICIANS. | Automotive Engineering Technology/Technician. | 15.0803 | 2.5 |
| 15 | ENGINEERING/ENGINEERING-RELATED TECHNOLOGIES/TECHNICIANS. | Mechanical/Mechanical Engineering Technology/Technician. | 15.0805 | 2.5 |
| 15 | ENGINEERING/ENGINEERING-RELATED TECHNOLOGIES/TECHNICIANS. | Mechanical Engineering Related Technologies/Technicians, Other. | 15.0899 | 2.5 |
| 15 | ENGINEERING/ENGINEERING-RELATED TECHNOLOGIES/TECHNICIANS. | Engineering-Related Technologies/Technicians, Other. | 15.1199 | 2.5 |
| 15 | ENGINEERING/ENGINEERING-RELATED TECHNOLOGIES/TECHNICIANS. | Computer Engineering Technology/Technician. | 15.1201 | 2.5 |
| 15 | ENGINEERING/ENGINEERING-RELATED TECHNOLOGIES/TECHNICIANS. | Computer/Computer Systems Technology/Technician. | 15.1202 | 2.5 |
| 15 | ENGINEERING/ENGINEERING-RELATED TECHNOLOGIES/TECHNICIANS. | Computer Hardware Technology/Technician. | 15.1203 | 2.5 |
| 15 | ENGINEERING/ENGINEERING-RELATED TECHNOLOGIES/TECHNICIANS. | Computer Software Technology/Technician. | 15.1204 | 2.5 |
| 15 | ENGINEERING/ENGINEERING-RELATED TECHNOLOGIES/TECHNICIANS. | Computer Engineering Technologies/Technicians, Other. | 15.1299 | 2.5 |
| 15 | ENGINEERING/ENGINEERING-RELATED TECHNOLOGIES/TECHNICIANS. | Drafting and Design Technology/Technician, General. | 15.1301 | 2.5 |
| 15 | ENGINEERING/ENGINEERING-RELATED TECHNOLOGIES/TECHNICIANS. | CAD/CADD Drafting and/or Design Technology/Technician. | 15.1302 | 2.5 |
| 15 | ENGINEERING/ENGINEERING-RELATED TECHNOLOGIES/TECHNICIANS. | Civil Drafting and Civil Engineering CAD/CADD. | 15.1304 | 2.5 |
| 15 | ENGINEERING/ENGINEERING-RELATED TECHNOLOGIES/TECHNICIANS. | Electrical/Electronics Drafting and Electrical/Electronics CAD/CADD. | 15.1305 | 2.5 |
| 15 | ENGINEERING/ENGINEERING-RELATED TECHNOLOGIES/TECHNICIANS. | Mechanical Drafting and Mechanical Drafting CAD/CADD. | 15.1306 | 2.5 |
| 15 | ENGINEERING/ENGINEERING-RELATED TECHNOLOGIES/TECHNICIANS. | 3-D Modeling and Design Technology/Technician. | 15.1307 | 2.5 |
| 15 | ENGINEERING/ENGINEERING-RELATED TECHNOLOGIES/TECHNICIANS. | Drafting/Design Engineering Technologies/Technicians, Other. | 15.1399 | 2.5 |
| 15 | ENGINEERING/ENGINEERING-RELATED TECHNOLOGIES/TECHNICIANS. | Nuclear Engineering Technology/Technician. | 15.1401 | 2.5 |
| 15 | ENGINEERING/ENGINEERING-RELATED TECHNOLOGIES/TECHNICIANS. | Engineering/Industrial Management. | 15.1501 | 2.5 |
| 15 | ENGINEERING/ENGINEERING-RELATED TECHNOLOGIES/TECHNICIANS. | Engineering Design. | 15.1502 | 2.5 |
| 15 | ENGINEERING/ENGINEERING-RELATED TECHNOLOGIES/TECHNICIANS. | Packaging Science. | 15.1503 | 2.5 |
| 15 | ENGINEERING/ENGINEERING-RELATED TECHNOLOGIES/TECHNICIANS. | Engineering-Related Fields, Other. | 15.1599 | 2.5 |
| 15 | ENGINEERING/ENGINEERING-RELATED TECHNOLOGIES/TECHNICIANS. | Nanotechnology. | 15.1601 | 2.5 |
| 15 | ENGINEERING/ENGINEERING-RELATED TECHNOLOGIES/TECHNICIANS. | Energy Systems Technology/Technician. | 15.1701 | 2.5 |
| 15 | ENGINEERING/ENGINEERING-RELATED TECHNOLOGIES/TECHNICIANS. | Power Plant Technology/Technician. | 15.1702 | 2.5 |
| 15 | ENGINEERING/ENGINEERING-RELATED TECHNOLOGIES/TECHNICIANS. | Solar Energy Technology/Technician. | 15.1703 | 2.5 |
| 15 | ENGINEERING/ENGINEERING-RELATED TECHNOLOGIES/TECHNICIANS. | Wind Energy Technology/Technician. | 15.1704 | 2.5 |
| 15 | ENGINEERING/ENGINEERING-RELATED TECHNOLOGIES/TECHNICIANS. | Hydroelectric Energy Technology/Technician. | 15.1705 | 2.5 |
| 15 | ENGINEERING/ENGINEERING-RELATED TECHNOLOGIES/TECHNICIANS. | Geothermal Energy Technology/Technician. | 15.1706 | 2.5 |
| 15 | ENGINEERING/ENGINEERING-RELATED TECHNOLOGIES/TECHNICIANS. | Energy Systems Technologies/Technicians, Other. | 15.1799 | 2.5 |
| 15 | ENGINEERING/ENGINEERING-RELATED TECHNOLOGIES/TECHNICIANS. | Engineering/Engineering-Related Technologies/Technicians, Other. | 15.9999 | 2.5 |
| 16 | FOREIGN LANGUAGES, LITERATURES, AND LINGUISTICS. | Linguistics. | 16.0102 | 1.5 |
| 26 | BIOLOGICAL AND BIOMEDICAL SCIENCES. | Biostatistics. | 26.1102 | 1.5 |
| 26 | BIOLOGICAL AND BIOMEDICAL SCIENCES. | Bioinformatics. | 26.1103 | 1.5 |
| 26 | BIOLOGICAL AND BIOMEDICAL SCIENCES. | Computational Biology. | 26.1104 | 1.5 |
| 26 | BIOLOGICAL AND BIOMEDICAL SCIENCES. | Biomathematics, Bioinformatics, and Computational Biology, Other. | 26.1199 | 1.5 |
| 27 | MATHEMATICS AND STATISTICS. | Mathematics, General. | 27.0101 | 1.5 |
| 27 | MATHEMATICS AND STATISTICS. | Algebra and Number Theory. | 27.0102 | 1.5 |
| 27 | MATHEMATICS AND STATISTICS. | Analysis and Functional Analysis. | 27.0103 | 1.5 |
| 27 | MATHEMATICS AND STATISTICS. | Geometry/Geometric Analysis. | 27.0104 | 1.5 |
| 27 | MATHEMATICS AND STATISTICS. | Topology and Foundations. | 27.0105 | 1.5 |
| 27 | MATHEMATICS AND STATISTICS. | Mathematics, Other. | 27.0199 | 1.5 |
| 27 | MATHEMATICS AND STATISTICS. | Applied Mathematics, General. | 27.0301 | 1.5 |
| 27 | MATHEMATICS AND STATISTICS. | Computational Mathematics. | 27.0303 | 1 |
| 27 | MATHEMATICS AND STATISTICS. | Computational and Applied Mathematics. | 27.0304 | 1.5 |
| 27 | MATHEMATICS AND STATISTICS. | Financial Mathematics. | 27.0305 | 1.5 |
| 27 | MATHEMATICS AND STATISTICS. | Mathematical Biology. | 27.0306 | 1.5 |
| 27 | MATHEMATICS AND STATISTICS. | Applied Mathematics, Other. | 27.0399 | 1.5 |
| 27 | MATHEMATICS AND STATISTICS. | Statistics, General. | 27.0501 | 1 |
| 27 | MATHEMATICS AND STATISTICS. | Mathematical Statistics and Probability. | 27.0502 | 1.5 |
| 27 | MATHEMATICS AND STATISTICS. | Mathematics and Statistics. | 27.0503 | 1.5 |
| 27 | MATHEMATICS AND STATISTICS. | Statistics, Other. | 27.0599 | 1.5 |
| 27 | MATHEMATICS AND STATISTICS. | Applied Statistics, General. | 27.0601 | 1 |
| 27 | MATHEMATICS AND STATISTICS. | Mathematics and Statistics, Other. | 27.9999 | 1.5 |
| 30 | MULTI/INTERDISCIPLINARY STUDIES. | Mathematics and Computer Science. | 30.0801 | 1.5 |
| 30 | MULTI/INTERDISCIPLINARY STUDIES. | Computational Science. | 30.3001 | 1.5 |
| 30 | MULTI/INTERDISCIPLINARY STUDIES. | Economics and Computer Science. | 30.3901 | 1.5 |
| 30 | MULTI/INTERDISCIPLINARY STUDIES. | Linguistics and Computer Science. | 30.4801 | 1 |
| 30 | MULTI/INTERDISCIPLINARY STUDIES. | Mathematical Economics. | 30.4901 | 1.5 |
| 30 | MULTI/INTERDISCIPLINARY STUDIES. | Data Science, General. | 30.7001 | 1 |
| 30 | MULTI/INTERDISCIPLINARY STUDIES. | Data Science, Other. | 30.7099 | 1 |
| 30 | MULTI/INTERDISCIPLINARY STUDIES. | Data Analytics, General. | 30.7101 | 1 |
| 30 | MULTI/INTERDISCIPLINARY STUDIES. | Business Analytics. | 30.7102 | 1.5 |
| 30 | MULTI/INTERDISCIPLINARY STUDIES. | Data Analytics, Other. | 30.7199 | 1.5 |
| 40 | PHYSICAL SCIENCES. | Analytical Chemistry. | 40.0502 | 2.5 |
| 40 | PHYSICAL SCIENCES. | Inorganic Chemistry. | 40.0503 | 2.5 |
| 40 | PHYSICAL SCIENCES. | Physical Chemistry. | 40.0506 | 2.5 |
| 40 | PHYSICAL SCIENCES. | Polymer Chemistry. | 40.0507 | 2.5 |
| 40 | PHYSICAL SCIENCES. | Chemical Physics. | 40.0508 | 2.5 |
| 40 | PHYSICAL SCIENCES. | Theoretical Chemistry. | 40.0511 | 2.5 |
| 40 | PHYSICAL SCIENCES. | Cheminformatics/Chemistry Informatics. | 40.0512 | 2.5 |
| 40 | PHYSICAL SCIENCES. | Chemistry, Other. | 40.0599 | 2.5 |
| 40 | PHYSICAL SCIENCES. | Physics, General. | 40.0801 | 2.5 |
| 40 | PHYSICAL SCIENCES. | Atomic/Molecular Physics. | 40.0802 | 2.5 |
| 40 | PHYSICAL SCIENCES. | Elementary Particle Physics. | 40.0804 | 2.5 |
| 40 | PHYSICAL SCIENCES. | Plasma and High-Temperature Physics. | 40.0805 | 2.5 |
| 40 | PHYSICAL SCIENCES. | Optics/Optical Sciences. | 40.0807 | 2 |
| 40 | PHYSICAL SCIENCES. | Condensed Matter and Materials Physics. | 40.0808 | 2 |
| 40 | PHYSICAL SCIENCES. | Theoretical and Mathematical Physics. | 40.0810 | 2.5 |
| 40 | PHYSICAL SCIENCES. | Physics, Other. | 40.0899 | 2.5 |
| 40 | PHYSICAL SCIENCES. | Materials Science. | 40.1001 | 2.5 |
| 40 | PHYSICAL SCIENCES. | Materials Chemistry. | 40.1002 | 2.5 |
| 40 | PHYSICAL SCIENCES. | Materials Sciences, Other. | 40.1099 | 2.5 |
[1] For example, parts of the production process of semiconductors—like design and fabrication—require more highly trained labor, while others—like assembly—require less training.
[2] While hardware expertise is still valuable for AI companies, the rise of cloud computing is diminishing the importance of competition on technical (as opposed to algorithmic) frontiers.
[3] For example, as of August 16, 2024, OpenAI had an open job posting for a “GPU Kernels Engineer,” which sought applicants with “a deep understanding of GPU, CPU, or other AI accelerator architectures” and “experience building compilers.”
[4] As discussed later, this classification does not include other relevant talent pools, including labor in the electric power or construction industries, which will similarly need to scale up to support AI growth.
[5] The dataset is based on 45 frontier models, defined as those that were among the 10 models using the most computing power for training at the time of release.
[6] The total cost (including labor) of training Google DeepMind’s Gemini Ultra was estimated to be $130 million.
[7] According to Glassdoor, where people can anonymously submit their salaries, the average annual base salary for an AI Engineer as of June 2024 was $204,000, compared to $92,000 for a Computer Engineer.
[8] The AI-related skills included in this analysis are the following: Generative AI, Robotics, Visual image recognition, Neural networks, Autonomous driving, Natural language processing , Artificial intelligence, Machine learning.
[9] 24 are classified as directly relevant AI software, 27 as indirectly relevant to AI software, 16 as relevant to AI hardware, and 87 as indirectly relevant to AI hardware.
[10] Computer science accounts for 28 percent; Computer and informational sciences accounts for 14 percent.
[11] The number of all bachelor’s, master’s, and doctorate degrees awarded in the U.S. grew by 14, 22, and 40 percent, respectively since 2010.
[12] Additionally, the quality of international data may vary, which means that cross-country comparisons should be interpreted cautiously.
[13] “Science” usually includes fields in the physical sciences, computer science, and mathematics; see Appendix A for more information.
[14] The distinction between STEM and S&E is significant: among 2022 Chinese doctorate graduates, 28% of STEM graduates were in Agriculture or Medicine.
[15] These figures represent a higher share of unweighted field counts, because fields that are both AI-relevant and in the S&E categorization (like Computer Science or Mechanical Engineering) tend to have higher numbers of graduates.
[16] This report does not include master’s degrees for international comparisons due to lower data quality.
[17] This is primarily due to the fact that China awards a relatively high ratio of S&E BAs to PhDs: the United States awards between 13 and 15 BAs for every PhD it awards, while China awards about 41 BAs per PhD.
[18] Country affiliations are determined by the headquarters of the company; individual workers may be working in different countries.
[19] China’s gains are also evident when looking at the most elite AI researchers—a subset of the top AI researchers referenced above. In 2019, 65 percent of the most elite AI researchers worked in U.S. companies, and a vanishingly small fraction worked in China; by 2022, the share of elite researchers working in the United States had shrunk to 57 percent, and the number of researchers working in China was 12 percent, above the share of all other countries besides the United States.
[20] CEA’s calculations assume the following flows: of Chinese PhDs, 90.71 percent now work in China, 3.57 percent work in the United States, and 5.71 percent work elsewhere; of American PhDs, 80.15 percent work in the United States, 6.74 percent now work in China, and 13.12 percent work elsewhere.
[21] This calculation uses the shares from footnote 19. Post-grad workers in China who graduated from Chinese PhDs are 75.2 percent of top AI researchers in China and 90.7 percent of Chinese graduates. Similarly, post-grad workers in China who graduated from U.S. programs are 10.7 percent of top AI researchers in China and 6.7 percent of U.S. graduates. With a bit of algebra, this implies that the ratio of U.S. to Chinese graduates—limiting to those who became top AI researchers—is 1.9.
[22] As defined by those with papers accepted at NeurIPS, one of the most prestigious machine learning conferences, which Macro Polo considers to be a measure of top talent.
[23] The fact that most labs are in the United States possibly confers an additional advantage for U.S. researchers who can substitute on-the-job training in a lab for an AI-related degree.
[24] In Engineering: Engineering, General; Engineering Technologies/Technicians, General.
In Science: Computer and Information Sciences, General; Science Technologies/Technicians, General; Mathematics, General; Physical Sciences, General.