Racial Disparities in Government Contracting
Executive Summary
This report from the White House Council of Economic Advisers (CEA) uses data from studies of state and local government contracting, documents racial gaps in contracting dollars, and provides new evidence that discrimination likely plays a role. Specifically, CEA conducted a re-analysis of two meta-studies that summarize hundreds of individual studies with racial disparity ratios of state and local government contracting, covering most states, cover several broad categories of industry, and span contracts awarded between 1977 and 2019. The CEA has re-examined these combined data and also linked data from these studies to well-established measures of racial bias used in social science research to draw key new insights. The CEA analysis establishes the following facts.
- Racial disparities in contracting dollars exist with minority-owned firms receiving a smaller share of contracting dollars than their representation among available firms.
- Representation gaps are not restricted to any one ethnic group, as significant gaps exist between white-owned firms and Black, Hispanic, Asian and Native American owned firms.
- Disparities have not improved significantly since the 1990s and were larger in the years leading up until 2019 than any period covered in the data.
- Disparities are much more pronounced in terms of contracting dollars as opposed to being a contractor at all. This is due to minority firms being much less likely to be the prime contractor and generally receiving smaller contracts than non-minority owned firms.
- Disparities by race are larger in geographic locations with more measured racial bias (based on accepted measures of racial bias used in social science) – suggesting that racial discrimination may play a role.
- The relationship between racial bias and racial gaps in contracting persists even when accounting for observable measures of available minority businesses (such as the minority share of the population, the educational level of the minority population in the area, and the number of available minority-owned firms).
- Disparities only exist (in a statistically significant way) in areas with moderate and high levels of bias, and statistical models show that if all places were like those with the least racial bias, the overall racial disparities in contracting could largely be eliminated.
- Disparities are much smaller when disadvantaged business enterprise (DBE) goals are in place regarding the participation of small business owned and controlled by socially and economically disadvantaged individuals.
- Racial bias is largely unrelated to racial disparities in contracting disparities when DBE goals are in place, and the presence of DBE goals mitigates minority underrepresentation associated with bias. Further evidence that racial discrimination plays a role in existing gaps, and that these can be mitigated with DBE goals.
Equal opportunity is the bedrock of American democracy, and the diversity of our Nation remains one of its greatest strengths. While the Civil Rights Act of 1964 marked a pivotal step toward dismantling legal racial segregation and the legacy of widespread discrimination in public life, the cumulative effects of past discriminatory government policies still persist today. As noted in the July 2024 CEA issue brief, Racial Discrimination in Contemporary America, thepersistence of differential treatment by race in access to housing, employment, and mortgage loans or business capital indicates that racial discrimination still exists today and plays a role in explaining current racial wealth gaps. Recognizing this, the federal government has taken steps to advance equity and economic inclusion, particularly within federal contracting; and continues the work catalyzed by the Civil Rights Act to proactively ensure all Americans are afforded equal protections and opportunity to fully realize their potential.
The Biden-Harris Administration has implemented policies aimed at reducing barriers to access in federal programs and addressing racial disparities in federal contracting, contributing to significant growth in entrepreneurship and small business supplier diversity. Since taking office, over 20 million new business applications have been filed—the highest number ever recorded in a single presidential term. Business ownership has doubled among Black households, reached a 30-year high among Hispanic households, and hit a similar milestone for Asian American entrepreneurs. Women also now own a larger share of businesses than before the pandemic, reflecting expanded economic opportunities facilitated by the administration’s focus on equitable access to federal contracting.
To reduce gaps in federal contracting, in 2021, President Biden announced a goal of increasing the share of contracts awarded to small disadvantaged businesses (SDBs) to 15 percent of total annual federal contracting dollars—representing a 50 percent increase in spending—by 2025. This commitment builds on President Biden’s day one Executive Order advancing racial equity and support for underserved communities through the federal government, which among other actions, directed federal agencies to remove barriers to contracting opportunities for minority-owned businesses.
Most recently, in Fiscal Year 2023, federal agencies awarded $178.6 billion in contracts to small businesses, representing 28.4 percent of all eligible contracting dollars—a record high. Of this amount, $76.2 billion went to SDBs, underscoring the Biden-Harris Administration’s efforts to address long-standing disparities in federal procurement, promote equitable contracting practices, and expand economic opportunity for all.
Introduction
Government contracting is the process in which federal, state, and local government agencies and entities pay for products or services provided by businesses. There are three main tiers of government contracts pertaining to the purchase of goods and services: one is federal procurement financed with federal funds; a second is state and local procurement financed with federal funds; and a third is state and local governments using their own funds. This CEA issue brief is focused on state and local government contracts (irrespective of the financing source), which amounted to 11 percent of GDP in 2018. These large-scale purchasing decisions have the power to promote innovation, job creation, and help business owners (and their communities) build wealth.
Given the importance of government contracting, how government contracts are allocated has important distributional implications. At present, there are racial disparities in contracting, with minority-owned firms earning a smaller share of contracting dollars than their proportion of available firms. Looking at Federal contracting (for which national data are available), in 2020, while minority-owned firms made up 33.7 percent of all businesses in the United States, they accounted for only 10.1 percent of the federal contracting dollars. Similarly, between 2014 and 2019, estimates from Wainwright (2022) indicate that minorities made up 15.0 percent of available firms but accounted for only 6.3 percent of state and local contracting dollars.[1]
These disparities by race have implications for racial gaps in access to business, and wealth creation. This under-representation in government contracting may reflect two kinds of barriers: (1) barriers to firm formation and growth which may preclude competitive bidding for government contracts, and (2) barriers to participation in the government contracting process even among firms that could compete for contracts. While both of these kinds of barriers are important, this study focuses on the second and highlights the role that race-based discrimination may play.
We conduct a re-analysis of two meta-studies on racial disparity ratios of state and local government contracting. We present new patterns in the data and provide fresh evidence of trends over time. Also, we follow approaches in social science to examine patterns of disparity ratios across settings and contexts to provide compelling evidence of discrimination (as discussed in a recent CEA issue brief). Specifically, we find that racial gaps in contracting are larger in geographic locations that have higher levels of proxies for racial bias. These patterns persist even when accounting for racial difference in population, education, and firm availability. Further, we show that having disadvantaged business enterprise (DBE) goals regarding the participation of small business owned and controlled by socially and economically disadvantaged individuals, mitigates the association between measures of racial bias and racial contracting gaps.
These patterns suggest that racial gaps in contracting may worsen without the buffer of affirmative action to mitigate the ill-effect of racial bias. While not all biases are explicit and intentional, the prevalence and impact of implicit bias shows the limitations of relying solely on race-neutral tools to advance equality of opportunity.
Background
Racial disparities in government contracting are defined relative to what would be observed without discrimination. A common metric used to measure this gap is the “disparity ratio.” This ratio is a fraction where the numerator represents the proportion of contract dollars—or number of contracts—awarded to minority-owned businesses. The denominator, which adjusts for the prevalence of minority firms, is the proportion of all available businesses that are minority-owned.

A disparity ratio less than one means that minority businesses receive fewer contracting dollars than their share of available businesses. A ratio more than one means that minority businesses receive more contracting dollars than their share of available businesses. The disparity ratio can be as low as zero (if no contracts are awarded to minorities) and can be much greater than one (if minority-owned firms receive more contract dollars than would be expected based on their prevalence among available firms). A ratio of one means that minority owned businesses receive the same fraction of government contracts as their share of available businesses.[2]
Interpreting the Disparity Ratio
Since the U.S. Supreme Court’s decision in City of Richmond v. J.A. Croson Co., 488 U.S. 469 (1989), courts have generally held that disparity studies provide evidence of discrimination in public contracting and the continuing effects of such discrimination. However, because there may be differences between the set of available minority-owned and non-minority-owned firms, the disparity ratio, in and of itself, may not be dispositive on the existence of discrimination or lack thereof.
For example,a disparity ratio below 1 indicates that minority-owned businesses receive a smaller share of government contracts compared to their availability—consistent with race-based discrimination. However, because minority-owned firms may have less-experienced owners or less capacity to undertake contracted work, a ratio below 1 does not necessarily indicate race-based discrimination during contract awards. Conversely, a disparity ratio of 1 or above indicates that available minority-owned businesses receive a larger share of government contracts compared to their availability. While a ratio of 1 or above is consistent with no race-based discrimination, as explained below, it does not rule out race-based discrimination and could still reflect the presence of discrimination. Some studies compute disparity ratios only among the set of firms that have previously received government contracts since these firms are all considered qualified candidates (the definition of “available firms” is discussed below, in footnote 3). However, this approach can lead to a counterintuitive result: Discrimination against minority firms in attaining contractor status might result in only highly qualified minority-owned firms being part of the available group. Consequently, these exceptional minority-owned firms may disproportionately earn more contracting dollars, leading to a disparity ratio greater than 1.
In sum, interpreting disparity ratios as being indicative of discrimination—or indicative of the absence of discrimination—requires careful consideration of the setting and context. Importantly, social scientists have found ways to examine patterns of disparity ratios across settings and contexts that can provide compelling evidence of discrimination (as discussed in recent CEA analysis). This CEA issue brief summarizes these approaches, applies them to disparity ratios for government contracting, and provides compelling evidence of racial disparities in contracting that are likely due to race-based discrimination.
Ways to Show That These Gaps Reflect Racial Discrimination
Social scientists often assess the extent of discrimination by testing for differences in disparity ratios across settings with where it is known, ex ante, that discrimination is more or less likely to exist. We implement three tests of this nature to assess the role of discrimination in explaining racial gaps in contracting.
Test 1: One way to show that a given disparity ratio likely reflects underlying discrimination is to show that these gaps are larger in places with more prejudice and discriminatory attitudes. The theory that areas with stronger prejudice would exhibit larger unwarranted racial disparities was proposed by Becker (1957) and is supported by empirical data.
While prejudice and bias are challenging to measure, we use a measure of implicit bias that has been validated by researchers. Implicit Association Test (IAT) scores (Greenwald, Nosek, and Banaji, 2003) measure subconscious biases that individuals have towards various groups of people. It is based on the speed at which respondents are able to associate positive words and concepts with Black/Hispanic/Asian/Native American versus White faces, or the words “Black/Hispanic/Asian/Native American” versus “White.” The American Academy of Arts and Sciences most recent issue of Daedalus is dedicated to understanding implicit bias, and provides much discussion of these measures. In a recent issue brief, CEA summarized research showing that places with higher levels of these measures of bias have larger racial gaps in a number of settings where there are no differences other than race or where any differences should have no effect on the outcomes—what economists refer to as unwarranted disparities. These measures predict unwarranted disparities in wages, mortality, business loans, job interviews and job offers, and housing applications.
To examine whether contracting gaps are larger in geographic locations that have higher levels of proxies for racial bias, the CEA used data from two meta-studies of disparity ratios (Enchautegui et al., 1997 and Wainwright, 2022). Together, these two meta-studies summarize hundreds of individual studies with disparity ratios of state and local government contracting, cover most states that represent about 90 percent of the population, cover several broad industry categories, and span contracts awarded between the 1970s and 2019. The data contained in these two meta-studies provide a good sense of racial contracting gaps at the state and local level over the last few decades.
Test 2A: Another test for the role of discrimination is to assess whether disparity ratios are larger when contracts have no disadvantaged business enterprise goals in place. The basic idea is that contracts that have DBE goals in place are explicitly designed to counteract the effect of any pre-existing racial bias on contracting. As such, if these DBE goals are successful, the disparity ratios should be larger in setting with such goals in place.
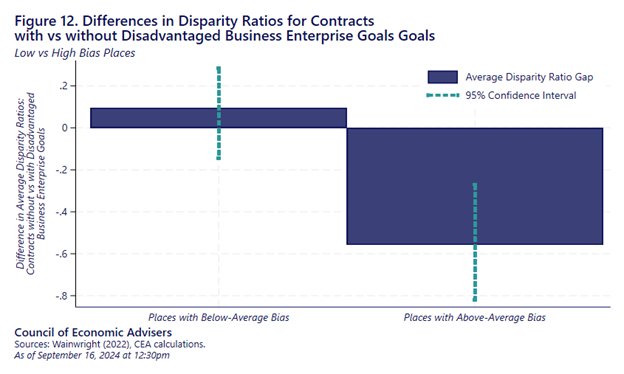
Test 2B: A final test combines the logic of the first two tests and assesses whether the relationship between racial bias and disparity ratios are weaker in contexts with DBE goals. The basic idea is that contracts that have DBE goals in place are actively seeking to counteract the effect of any pre-existing racial bias on contracting, so that the relationship between disparity ratios and local measures of racial bias would be much weaker when DBE goals are in place. That is, if there is less racial discrimination to overcome in areas with lower levels of bias, then in low bias areas, disparity ratios should be similar regardless of a contract’s DBE goal status. Conversely, if there is more racial discrimination to overcome in areas with higher levels of bias, then in high bias areas, disparity ratios should be larger among contracts with no DBE goals than those with such goals. This is exactly what the data show. Importantly, not only is this a test of the existence of discrimination, but also a test of the efficacy of DBE goals at mitigating the negative effects of racial bias.
Data Set 1: The Urban Study
The first meta-study we use, Enchautegui et al. (1997) was conducted by the Urban Institute. The goal of Enchautegui et al. (1997) was to examine the extent to which minority-owned firms receive a representative share of state and local government contract dollars. This meta-study screened 95 state and local disparity studies and kept 58 studies that were comparable and allowed for a meta-study.[3] The 58 studies in Enchautegui et al. (1997) examine contracts for a variety of governmental units including cities, counties, states, and special districts such as schools, transportation agencies, and water resource authorities. We focus on these studies that span 1977 to 1994. Information provided includes the contract industry (i.e., construction, goods, or services), location (generally a city or county), the total number of contracts involved per study, year, disparity ratio, and availability of minority owned firms, defined for Black, Hispanic, Asian, Native American, and all minorities.[4] These studies span 32 cities and counties in 19 states (including D.C.).[5]
Data Set 2: The Wainwright Study:
The second meta-study we use is Wainwright (2022). The goal of this meta-study was to examine disparity studies commissioned by state and local governments and public contracting entities. This meta-study incorporates 205 studies that were published between 2010 and 2021—spanning contracts awarded between 2001 and 2019—and provides the contract industry; location (generally a city or county); value; whether the contract includes prime contracts, subcontracts, or both; the level of government funding source (i.e., local, federal, private, mixed public and private, or total/combined); the year; and the disparity ratio and availability of minority owned firms, defined for Black, Hispanic, Asian, Native American, and all minorities. The 205 studies span all nine Census Divisions, 33 states (including D.C.), and most industries in the U.S. economy.[1]
The 205studies used in Wainwright (2022) define availability in various ways, similar to the five approaches in Enchautegui et al. (1997). Each meta-study does not identify how exactly availability is defined for each individual study, although Wainwright and Holt (2010) discusses best practices in defining availability and alternate approaches that studies take. However, Wainwright (2022) does provide the set of authors for each study, so that one can look at patterns within groups of authors that use the same methodology across studies — allowing one to account for differences in methodology (which includes definitions of availability).
[1] Each study in Wainwright (2022) provides several disparity ratios, defined several ways. For example, a given study may be focused on a specific city or county, but it calculates disparity ratios for (1) various industries, (2) whether contract dollars are measured in terms of contracts awarded versus paid, (3) prime contracts versus sub contracts versus an aggregate of both, (4) individual racial and ethnic groups (i.e., Black, Hispanic, Asian, and Native American) as well as an overall minority aggregate, and (5) other factors, such as how availability is defined and at what geographic unit. To ensure that all studies receive the same weights in all models, we include all the estimated disparity ratios in analysis, but weight studies by the number of ratios included. For example, if one study provides 10 ratios, we include all 10 disparity radios but assign each ratio a weight of 1/10, so that each study gets the same weight of 1.
Patterns in The Data
Before implementing the tests for discrimination outlined above, we lay out some basic facts about disparity ratios in the included studies.
Average Disparity Ratios and Changes Over Time
By combining data for the individual disparity studies across both meta-studies and coding up the year of analysis, we can examine trends in disparity ratios over time. Figure 1 shows the average disparity ratio for each year across the studies in the two meta-studies.[7] We define disparity ratio in terms of all minority-owned firms (i.e., Black, Hispanic, Asian, or Native American). Years up to 1994 are from Enchautegui et al. (1997) and years after 2000 are from Wainwright (2022). For each year, the size of the circle is proportional to the number of studies in that year. The average annual disparity ratio will be more precise and reliable for years with more individual estimates.
In the earlier studies spanning 1977 through 1994, the average disparity ratio in Figure 1 is 0.82, indicating that minority-owned firms earned 82 percent of the contracting dollars that would have been consistent with their proportion of available firms. In the more recent studies spanning 2001 through 2019, the overall average disparity ratio is 0.69—indicating that minority-owned firms earned only 69 percent of the contracting dollars that would have been consistent with their representation among all available firms. These results indicate that estimated racial disparities exist and have grown over time.
To examine changes over time in more detail, we divide the sample into three time periods: 1977-1994, 2001-2013, and 2014-2019. The average disparity ratio in the first two time periods were 0.82 and 0.72, respectively—indicating that overall racial disparities in state and local contracting had been slowly falling between 1977 and 2013. However, the average ratio in the third (more recent) period was significantly lower at 0.53. That is, while minority-owned firms earned about 82 percent of what would have been expected based on their representation in studies covering between 1977 and 1994, in more recent studies of firms in 2014 and later, they earned just over half of what would have been expected given their representation.

The declining disparity ratios over time is profound—which, if taken at face value, suggests a considerable worsening of racial gaps in contracting in the past 10 years. Given that the negative trend over time reflects comparisons across different studies, this trend could reflect differences in methodology over time. To address the possibility that this negative trend reflects different approaches, we take advantage of the fact that some groups of authors conducted several studies over time and are identified in the Wainwright (2022) data. This allows us to look at trends over time within the same set of authors—who employ the same methodological approach over time.[8] For illustrative purposes, Figure 2 shows the two sets of authors with several studies that span the early 2000s to the late 2010s, and have the most disparity ratio estimates: Griffin & Strong, PC (i.e., GSPC); and BBC Research & Consulting (i.e., BBC). These two sets of authors estimate multiple disparity ratios across 17 and 45 different studies, respectively. Within the GSPC studies, the overall linear slope is negative and statistically significant at -0.054. Within the BBC studies, the overall linear slope is negative and statistically significant at -0.040. Taking the average of these two groups of studies the linear slope is about -0.045. In a regression model that takes the average slope (estimated within each study group but across all studies to remove the influence of potential changes in methodology over time), the slope is equal to -0.043 and is statistically significant—indicative of falling disparity ratios over time. The slope can be interpreted to mean that every 10 years, the percent of contract dollars received by minority-owned firms, relative to what would be expected based on their availability, falls by 4.3 points. That is, the data indicate that fewer contracting dollars have been going to minority-owned firms relative to their representation over time—leading to growing racial gaps over time.

Difference by Race and Ethnic Group
Each individual study in both meta-studies shows the disparity ratio for individual groups (i.e., Black, Hispanic, Asian, and Native American[9]) and for the combined impact on all minorities. We now report on these disparities for different groups. Before discussing disparity ratios, it is helpful to look at some raw numbers for context. Figure 3 shows the fraction of the population represented by each group (in 2005, the average contract year), the fraction of firms deemed available by each study that are owned by each group[10], and the fraction of contracting dollars earned by each group across all years.[11] For each group, the fraction of firms owned by each group is significantly less than the group’s fraction of the population, suggesting that there are various barriers to starting and growing business for minorities—in addition to barriers faced by minority-owned firms applying for government contracts. Moreover, for each group, the share of contracting dollars received is smaller than the share of available firms—indicating that minority-owned firms have an underrepresentation of contracting dollars, which is true for Black, Hispanic, Asian, Native American, and the combined group of all minorities.
Looking at the fraction of contracting dollars going to minority-owned firms relative to the fraction of firms that are minority-owned (i.e., the disparity ratio) across all years (1977 to 2019), Figure 3 shows that the average Black disparity ratio is 0.75, Hispanic ratio is 0.72, Asian ratio is 0.83, Native American ratio is 0.66, and the overall minority ratio is 0.78. This means that, relative to their respective shares of available firms, Asian-owned business earn about 83 percent of contracting dollars as would be expected, Black-owned business earn about 75 percent of contracting dollars as would be expected, Hispanic-owned business earn about 72 percent of contracting dollars as would be expected, and Native-owned business earn only about 66 percent of contracting dollars as would be expected.

While disparity ratios are significantly lower than 1—indicating racial gaps in contracting—Figure 4 shows that the underrepresentation for minority-owned business is even larger in recent years. For minority-owned businesses, the overall share of contracting dollars received (relative to representation among available firms) fell from 82 percent in the 1977-1994 period to 53 percent in more recent years (2014 to 2019). These declines were most pronounced for Black-owned firms—where the relative share of contracting dollars fell from about 82 percent to 50 percent—and for Native American-owned firms—where the share fell from 77 to 56 percent. Hispanic firms saw a small decline from 75 to 72 percent and Asian firms saw a small increase from 81 to 85 percent. In sum, minority-owned firms saw a decline in the share of contracting dollars received relative to what would have been expected given their representation over time—driven largely by declines for non-Asian minority groups over time.

Differences by Sector
To provide a sense of which sectors have the largest disparities by race, Figure 5a shows average disparity ratios across all years within three broad contract industries: construction, goods, and services. Across all years, the disparity ratio for all minorities (grouped) is highest in construction at 93 percent, 70 percent in services, and lowest in goods at 55 percent. In other words, relative to their share of available firms, minority-owned businesses earn about 93 percent of contracting dollars in the construction sector, 70 percent of contracting dollars in the services sector, and just 55 percent of contracting dollars in the goods sector as would be expected. Note that the smaller gaps for the construction sector may be due, in part, to contracts in this sector being more likely to have DBE goals (which we show below is associated with smaller racial representation gaps). While large racial gaps exist, gaps are relatively smaller for Black- and Native American-owned firms in goods (ratios of 92 percent and 86 percent, respectively) and Asian- and Hispanic-owned firms in construction (ratios of 98 percent and 88 percent).

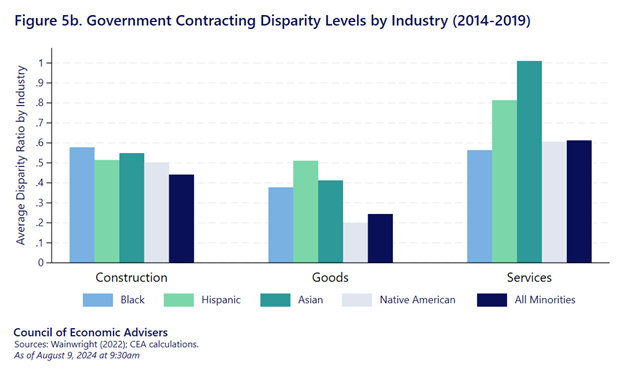
Figure 5b shows similar information, but focuses on more recent years—2014 to 2019. Figure 5b shows that average disparity ratios are generally much smaller in recent years, indicative of growing racial gaps in government contracting. Looking within sectors, the decline in disparity ratios is most pronounced for construction and goods—where the ratios for all minorities declined from 93 percent to 44 percent and 55 to 24 percent, respectively—and least pronounced for services, where the ratios for all minorities declined from 70 percent to 61 percent.
The Role of Contract Type and the Size of the Contract
One way that racial disparities in contracting dollars can emerge is by minority-owned firms receiving contracts of different type or smaller amounts. We explore this by looking at contract type. Government contracts can take two forms: prime and sub contracts. Prime contracts are agreements made directly with the government, and prime contractors assume responsibility for oversight of the whole contract or project. Prime contractors can hire subcontractors to perform specific tasks for the project, but subcontractors do not work directly with the government, and subcontracts make up a smaller share of procurement dollars than prime contracts. In the Wainwright (2022) data, between 2001 and 2019, the average prime contract was worth about 9 times more than the average subcontract.
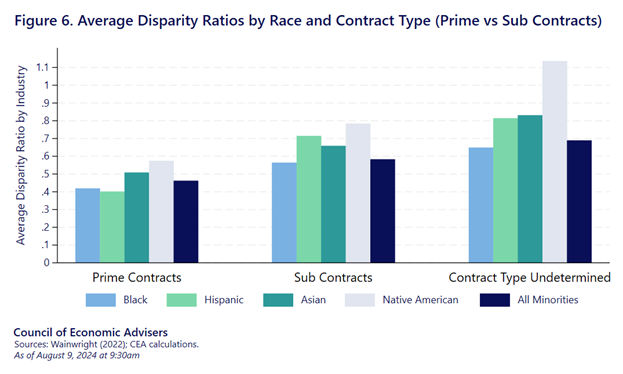
As a rule, an examination of the disparity ratios by contract type may shed light on whether minority owned firm are underrepresented among prime contracts, sub contracts, or all types of state and local government contracts. Using data spanning 2001 through 2019 (from Wainwright (2022) where contract type data are reported), Figure 6 examines disparity ratios by contract type—prime contracts, sub contracts, and contracts where the type is not determined —for each group (Black, Hispanic, Asian, Native American, and all minorities). In general, minority-owned businesses are relatively less likely to receive prime contracts (average disparity ratio of 0.51) and relatively more likely to receive sub contracts (average disparity ratio of 0.66), though they are significantly underrepresented for both contract types. This pattern of having a smaller disparity ratio for prime contracts holds for Black firms (0.46 versus 0.58), Hispanic firms (0.40 versus 0.71), Asian firms (0.57 versus 0.78), and Native American firms (0.42 versus 0.56).
One may wonder whether the racial gaps observed simply reflect minority-owned businesses receiving smaller contracts than non-minority-owned business, or if there are gaps in contracting status per se. To explore this, Figure 7 examines disparity ratios by whether disparity ratios are defined in terms of contract dollars or the number of contracts. Note that this is only possible using the older study—so that many of the ratios are higher than in more recent data—and the sample sizes are small for ratios in terms of number of contracts, so these ratios are measured with less precision. However, the analysis will still be instructive. In principle, if all firms are equally likely to receive contracts, but minority owned firms receive lower dollar amount contracts, one might see a large disparity ratio in dollar amounts, but small disparity ratios in the number of contracts.
Analysis of contracting data up through the 1990s is consistent with the interpretation of minority-owned firms being more likely to earn relatively smaller contracts. Looking across all minorities, the disparity ratio in terms on number of contracts is 0.99, which indicates that between 1977 and 1994 when racial gaps were smaller, minority-owned businesses receive a similar number of contracts one would expect based on their representation among available firms. However, even during that period of high disparities, for Asian owned-business the gap was appreciably smaller than 1 (at only 78 percent). In contracting, the disparity ratios in terms of dollars are all smaller than 1 (between 0.68 and 0.81)—indicating that in general (perhaps with the exception of Asian businesses), racial disparities in contracting dollars mainly emerge through the size of the contracts rather than receipt of any contract per se. It is important to note that one cannot conclude that there is currently no gap in the number of contracts, because the data used for figure 7 do not include the recent period, when representation gaps are considerably larger.
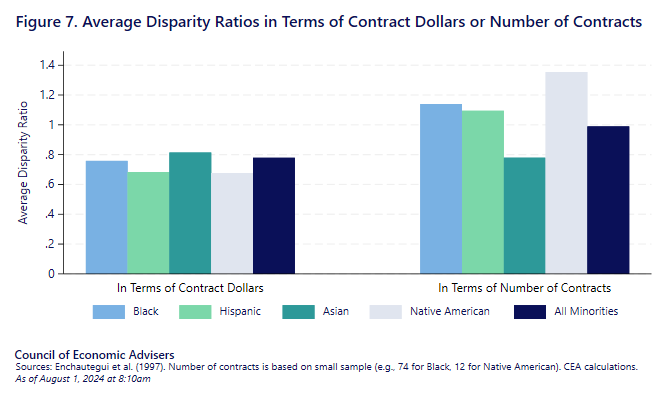
Together, Figures 6 and 7 indicate that minority-owned businesses are more likely to receive smaller contracts worth less than the average contract. That is, conditional on minority-owned businesses receiving government contracts, they tend to be smaller contracts.
Testing for Discrimination
Test 1: Relationship with Bias
Descriptive evidence above shows that on average, available minority contractors between 2014 and 2019 receive about 54 cents for every dollar received by available White contractors. Next, CEA uses data in these two meta-studies to create disparity ratios at the county level and show how these ratios correlate with local measures of racial bias.
Social scientists often explore whether observed racial gaps are due to discrimination by examining whether racial disparities are more pronounced in regions with higher levels of racial bias. The theory that areas with stronger prejudice would exhibit larger racial disparities was proposed by Becker (1957) and is supported by empirical data.
Researchers have employed various measures of racial bias, including public opinion questions such as “Would you object to sending your kids to a school that had [a certain fraction of] Black students?” Other measures of bias include measures of local housing segregation, the number of hate crimes against various groups, racially-biased Google searches, and implicit and explicit bias tests. For purposes of this analysis, we use a measure of implicit bias that comes from Implicit Association Test (IAT) scores (Greenwald, Nosek, and Banaji, 2003). This measures subconscious biases that individuals have towards various groups of people. It is based on the speed at which respondents are able to associate positive words and concepts with Black/Hispanic/Asian/Native American versus White faces or the word “Black/Hispanic/Asian/Native American” versus “White.” We take averages of this measure provided at the MSA or ZIP level and relate these to particular counties. We then relate these county-level bias measures to disparity ratios for the same geography.
Existing research shows that places with higher levels of this measure of prejudice have larger racial test score gaps, racial infant health gaps, and fewer loans for Black-owned businesses. In what follows, we show that these measures predict geographic variation in the prevalence of discrimination in government contracting.
Figure 8 uses data spanning 2001 through 2019 from Wainwright (2022) and plots average disparity ratios against local measures of implicit racial bias. This figure uses group-specific measures of disparity ratios and measures of implicit bias. That is, we relate the disparity ratio measures for Black-owned business to measures of implicit bias against Black people, we relate the disparity ratio measures for Hispanic-owned business to measures of implicit bias against Hispanic people, and do the same for Asian and Native American disparity ratios. The patterns are remarkably similar within each group, with each group receiving relatively fewer contracting dollars in areas with more bias.
Figure 8 reports disparity ratios by a standardized measure of bias. To provide some context, average bias would be a standardized value of zero, and going from -1.5 to +1.5 is analogous to going from a low to a high bias (about the 7th percentile of bias) to a low bias (about the 93rd percentile of bias) place. For ease of interpretation, the discussion below compares high versus low bias places, which we define as being 3 standard deviations apart.
For Black-owned businesses, being in a high-bias place versus a low-bias place leads to an average disparity ratio decrease of 0.20.[12] That is, being in a high-bias place versus a low-bias place leads to a 20 percent decrease in contract dollars received by Black-owned firms, relative to what would be expected based on their availability. CEA finds similar effects for other groups: For Hispanic-owned businesses, being in a high-bias place versus a low-bias place leads to a larger 47 percent decrease in contract dollars, relative to what would be expected based on their availability. For Native American businesses, the impact is 18 percent; and for Asian-owned businesses, the impact is 21 percent.
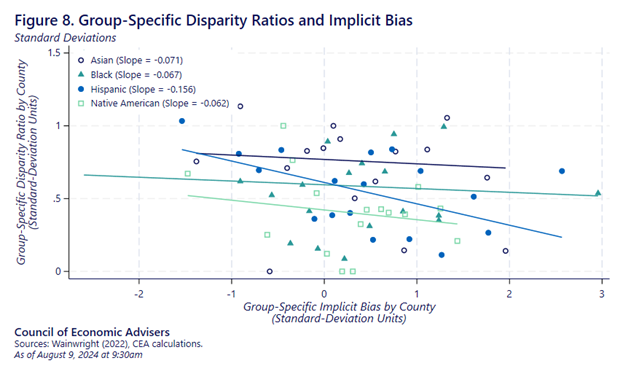
Figure 9a combines the impact from all four groups (shown in Figure 3).[13] Overall, across all included minority groups, being in a high-bias place versus a low-bias place leads to a 27 percent decrease in contract dollars received by minority-owned firms, relative to what would be expected based on their availability.[14] This figure also shows that disparity ratios are equal to about 1 in the lowest bias places—places with average bias below -2. Meanwhile, places with very high bias (above 2) have average ratios around 0.5. This difference in average disparity ratios between the highest and lower bias locations of about 0.5 represents a 50 percent decrease in contracting dollars earned by minority-owned firms relative to what would be expected based on their availability.
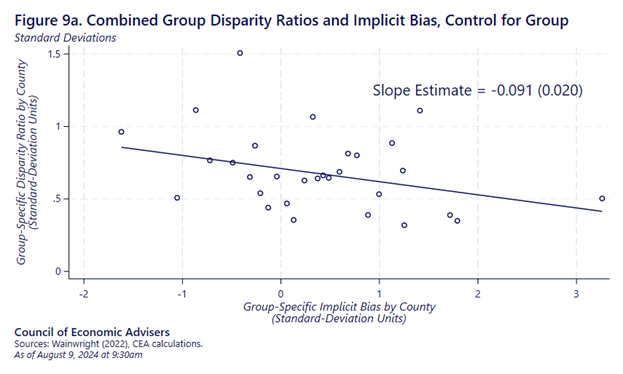
Robustness to controls
As one interprets the relationship between the disparity ratios and measures of bias, it is helpful to know whether this relationship can be accounted for by local measures of demographic traits, education, measures of firm availability, or measures of business quality. In the ideal, we would know about the capacity and experience of all firms to ensure that all available firms are similarly willing and able to take the contract. Unfortunately, these data are not available. However, we are able to measure a few such characteristics at the county level (based on 2000-2014 ACS data) and include these as controls in the model. Controls include indicators for group, year, and contract industry, along with county-level measures of each group’s fraction of the population, average years of education, education gap compared to average White years of education, and the group-level fraction of available firms.
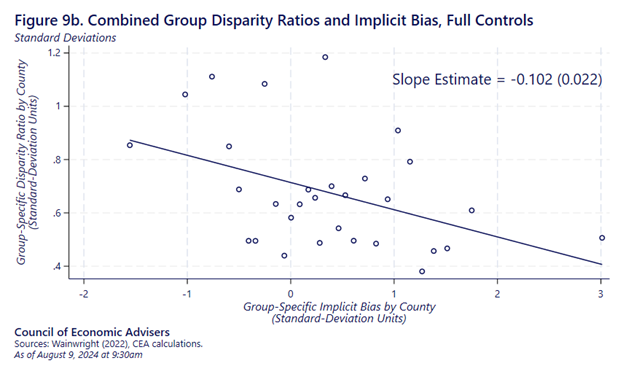
If the reason that places with more bias also tend to have lower disparity ratios is driven by the fact that places with more bias also tend to have lower levels of education for minorities, or fewer minorities in the local area, or biases are stronger in those places that have more sectors with fewer minority-owned firms, then accounting for these factors (that is, holding these factors fixed) would weaken the association between bias and the disparity ratios. To the contrary, Figure 9b shows that including additional controls does little to the overall relationship and actually makes it stronger. That is, after accenting for these factors, being in a high-bias place versus a low-bias place leads to a 30 percent decrease in contract dollars received by minority-owned firms, relative to what would be expected based on their availability.[15]
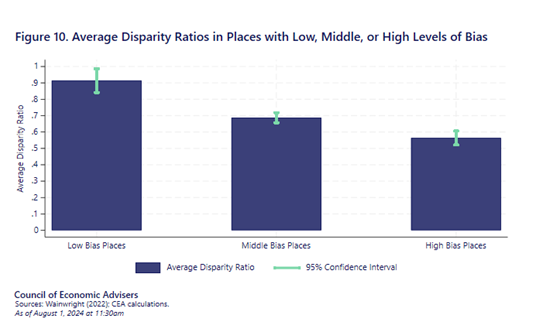
Observing the relationship between measures of bias and disparity ratios allows one to infer what disparities would exist if racial biases were largely eliminated. That is, the disparity ratios observed in low bias areas provides an indication of how much more equal outcomes could be, if areas with high levels of bias behaved more like areas with low levels of bias. Speaking to this point, Figure 10 shows that places with the least bias have average disparity ratios of 0.94, which is close to 1 and close to parity. Places with middle levels of bias have average ratios of 0.69, while places with high levels of bias have average ratios of 0.56. In other words, areas with low bias show little evidence of racial gaps, while the largest racial gaps exist in those areas with the highest levels of racial bias. Put differently, if all geographic locations nationwide were like those with the lowest level of measured racial bias, the representation of minority firms in contracting dollars would be almost on par with minority firms’ representation among businesses.
These results show a strong systematic relationship between measures of racial bias and an underrepresentation of minority-owned firms in government contracting in a particular county. This is consistent with the idea that the observed underrepresentation is driven in large part by racial bias. While we show that this relationship is not driven by minority populations being less educated or less available in areas with more racial bias, we cannot entirely rule out that racial bias is correlated with other unmeasured of the relative quality of minority-owned firms. As such, while the results strongly suggest a key role of racial bias, we cannot rule out other explanations. However, to bolster the claim that discrimination is at play, we present two more complimentary tests.
Test 2A: Differences for Contracts with Disadvantaged Business Enterprise Goals
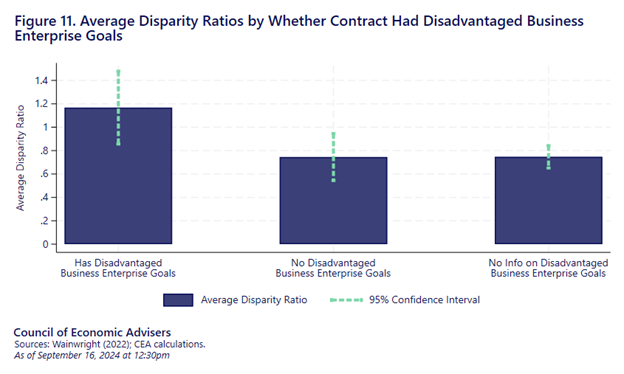
Wainwright (2022) data has a subset of studies that describe whether contracts had disadvantaged business enterprise goals in place. Many, but not all, of these studies were about the implementation of DBE programs for Federally funded contracts. These contracts had explicit goals for the participation of small business owned and controlled by socially and economically disadvantaged individuals. Contracts that had these goals should see larger disparity ratios than contracts without these goals. In fact, this is exactly what we see. Figure 11 shows that contracts that did have disadvantaged business enterprise goals in place had an average disparity ratio of 1.17 (which is not statistically different than 1); contracts that did not have disadvantaged business enterprise goals in place had an average ratio of 0.75; and contracts that provided no information on whether these goals were in place also had an average ratio of 0.75. These second two numbers are statistically smaller than 1.
Test 2B: Does Having Disadvantaged Business Enterprise Goals Mitigate the Negative Effects of Bias?
If discrimination occurs in government contracting, the disparity ratio gap (between contracts with and without disadvantaged business enterprise goals) should be larger in places with more bias. That is, having disadvantaged business enterprise goals should have little effect on disparity ratios for contracts in locations where there is no discrimination (as measured by below average bias). Conversely, having disadvantaged business enterprise goals would have large effects on disparity ratios for contracts in locations where there is discrimination (as measured by above average bias). Figure 12 shows exactly such a pattern. In places with lower measures of bias, disparity ratios are very similar for contracts with versus without disadvantaged business enterprise goals. However, in places with higher levels of bias, the difference in disparity ratios is much larger. These patterns provide further evidence that the observed disparity ratios on average may be driven by discrimination and also indicate that disadvantaged business enterprise goals may mitigate the ill effects of racial bias on contracting disparities.
Summarizing the Tests: If it looks like a duck…
There is no dispositive test regarding whether the disparity ratios that exist in government contracting by race reflect underlying discrimination. However, following best practice in social science we examine whether the disparity ratios behave as if they are the results of discrimination. Across all three tests, they do. That is, (a) areas with more racial bias also tend to have the largest representation gaps, (b) contracts that have disadvantaged business enterprise goals do not have any appreciable representation gaps while those without disadvantaged business enterprise goals do have gaps, and (3) the racial bias is only related to representation gaps for contracts that have no disadvantaged business enterprise goals in place. Following the reasoning in the famous quote “If it looks like a duck, swims like a duck, and quacks like a duck, then it probably is a duck.” That is, in several different ways, the disparity ratios look and behave as one would expect from discrimination, so it is reasonable to infer that racial discrimination plays a key role.
Conclusions and Implications
In the context of state and local government contracting, minority-owned businesses receive a smaller share of contracting dollars that would be expected based on their fraction of the population or fraction of available business able to carry out contracting work. Studies going back to the 1970s show that, on average, minority-owned businesses only earn about 75 percent as many government contracts as majority-owned businesses, accounting for differences in population and number of businesses by race and ethnicity. Furthermore, these gaps do not appear to be receding over time. In fact, racial gaps were larger in the 2010s than during the four decades before 2010. Between 2014 and 2019, minority-owned firms only received 53 percent as many contracting dollars as would be expected based on their fraction of available businesses. Racial gaps in contracting exist in all industries and these gaps are larger for prime contracts than for smaller sub contracts.
A key novel finding in this report is that contracting gaps are larger in places with more racial bias (as measured by validated measures of bias developed by social scientists). Minority-owned businesses in high-bias places receive about 30 percent less government contracting dollars than similar businesses in low-bias places. This pattern is evident for business owned by Black, Hispanic, Asian, and Native Americans. Moreover, the data show that contracts that have disadvantaged business enterprise goals do not have racial contracting gaps on average, and are able to eliminate the ill-effects of local racial biases on contracting gaps by race.
This analysis presents further evidence that race continues to be a significant determinant of economic well-being in the lives of many Americans. The prevalence and effect of implicit bias shows the limitations of relying solely on race-neutral tools to advance equality of opportunity. In various contexts, the research suggests that until there are no longer underlying implicit racial biases, race-conscious action—such as those under programs to promote the participation of DBEs—may be necessary to truly achieve equality of opportunity for all Americans.
By promoting equitable access to federal contracting and supporting minority-owned businesses, the Biden-Harris Administration has taken steps to reduce long-standing disparities in federal procurement. Closing these gaps is essential not only for fostering a more inclusive economy but also for maximizing the nation’s economic potential. Ensuring that all entrepreneurs, regardless of race or background, have a fair chance to compete for federal contracts strengthens economic growth, drives innovation, and creates jobs—benefiting communities across the United States.
[1] It is important to note that the definition of available firm can vary across studies, but it generally represents firms from in the same geographic location and industry.
[2] The same level of disparity can exist with very different levels of availability. For example, a disparity ratio of 1 can be consistent with the percentage of businesses that are minority-owned being 2 percent or 40 percent. It is also possible to have a disparity ratio of 1 and have all contract dollars awarded to minority firms going to a single firm.
[3] To be included in Enchautegui et al. (1997), a study had to (1) present its findings as disparity ratios or provide the data necessary to calculate disparity ratios; (2) report findings separately by industry categories; (3) report the number of contracts in each industry on which the disparity findings were based or report the statistical significance of each disparity finding; and (4) have more than 80 contracts for all years of the study period combined.
[4] Each study provides disparity ratios for (1) alternate groups of minorities; (2) alternate ways of defining the contract (i.e., contract dollars vs number of contracts); and (3) alternate data sources used to define availability of minority-owned businesses.
[5] The methods used by the 58 studies were quite consistent, although there are differences across studies, including how available firms are defined. Each study in Enchautegui et al. (1997) defines availability in one of five ways: (1) firms that have previously won government contracts; (2) firms that have bid on government contracts or expressed interest in doing so; (3) firms that have been certified as minority-owned; (4) firms that express interest in government contract work; and (5) all firms. Different definitions of available firms may lead to different conclusions about disparity ratios and the fraction of available firms that are minority-owned. Since there are many stages in the firm formation and procurement process at which discrimination can take place, from starting a business to winning a government contract, the more narrowly a measure screens for capacity, the more prior discrimination it builds in. In other words, a more restrictive definition of availability (e.g., firms that have previously bid on or won contracts) will not account for the influence of any bias that impacted the ability of minority-owned firms to get to that point.
[7] To avoid skewing the data by outliers with small samples, all disparity ratios of 5 or higher are coded up as 5.
[8] CEA was able to go into the individual study data for all GSBC studies and 28 of the 45 BBS studies, and verified that both BBC and GSPC used the same methodology for all studies that could be examined.
[9] Note that the definition of Native-owned business may have changed over time. For example, in 1986, two additional owner-groups, Indian tribes and Alaska Native Corporations (ANCs), became eligible for the 8 (a) program when Congress passed legislation providing that firms owned by Indian tribes, which include ANCs, were to be deemed socially disadvantaged for 8(a) Program purposes. R44844 (congress.gov).
[10] Recall that available can be defined in various ways such as those that have bid before, or earned a contract before, or meet some threshold of observable traits.
[11] For a small number of studies (about 5 percent), we use the disparity ratio based on the number of contracts because the ratio based on contracting dollars is not reported.
[12] Figure 8 shows that the impact of each one-standard-deviation increase in group-specific bias leads to average ratio decreases of 0.071, 0.067, 0.156, and 0.062 for Asian, Black, Hispanic, and Native American firms, respectively.
[13] This weights each group by their fraction of the population (shown in Figure 3).
[14] Figure 9a shows that each standard deviation increase in the group-specific bias leads to an average disparity ratio that is 0.091 smaller, or about 9.1 percent compared to what would be expected based on availability.
[15] Figure 9b shows that each standard deviation increase in the group-specific bias leads to an average disparity ratio that is 0.102 smaller, or about 10.2 percent compared to what would be expected based on availability.
