GDP Issue Brief
As today’s release marks the final new quarter of GDP data to be released during the Biden-Harris administration, CEA wanted to review this important indicator’s record over the President’s term.[1] Along with a strong showing for Q3—real GDP increased at an annual rate of 2.8% in the quarter—we summarize the Biden-Harris administration’s economic growth record as follows:
- Cumulatively, real GDP rose 12.6% since 2020Q4 during the Biden-Harris administration, a historically robust expansion.
- The expansion has defied expectations, consistently surpassing forecasters’ projections for growth, investment, and consumer spending. If we compare real GDP today with CBO’s last pre-pandemic forecast, today’s level is $3.3 trillion higher (24Q3 dollars), or $9,800 per capita than it was expected to be.
- The robust U.S. fiscal response partially explains why GDP growth and consumer spending were much stronger in the United States than in other advanced economies. U.S. real GDP growth since 2019Q4 was 11.4%, more than double the next-largest expansion in the G7.
- As fiscal support wound down, the full employment labor market delivered persistent real wage and income gains, further supporting consumer spending and growth.
- Real business fixed investment was also a strong performer, exceeding forecast expectations and cumulatively growing at 23% through 2024 Q3. This is partially due to investment induced by the IRA and CHIPS.
- Today’s report shows that headline inflation, as measured by the price index for Personal Consumption Expenditures (PCE), is down 4.6 percentage points from its peak in 2022Q2. Some commentators argued we’d need a recession to achieve that much disinflation, but real GDP growth since then has averaged 2.9% at an annual rate.
- Of course, our work is not done and we will continue to support policies to build on this strong macro-foundation, especially in areas where we can help to lower costs, including health care, housing, child care, and more.
As noted, today’s release showed that real GDP grew a strong 2.8% in 2024 Q3, slightly below market expectations. Real GDP growth was again powered by robust consumer spending, which contributed 2.5 p.p. to growth in the quarter. Government spending and business fixed investment also contributed positively to real GDP growth while net exports and residential investment subtracted from growth. Over the last year, real GDP growth has grown at an above-trend pace of 2.7%, largely due to strong consumer spending fueled by the healthy job market producing job gains and real wage growth. For further details on today’s strong report, see CEA’s X thread.
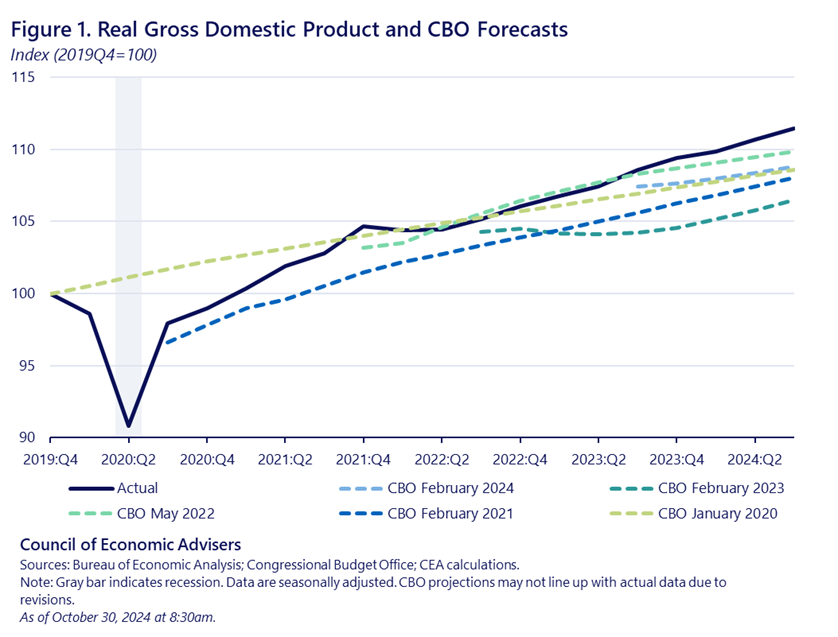
As CEA has previously noted, GDP has defied expectations and routinely beat forecasts over the last few years. That trend continues with today’s 2024 Q3 GDP release. As shown in figure 1, the level of real GDP this quarter exceeds all of the Congressional Budget Office’s projections since the start of the pandemic. It also beats CBO’s final pre-pandemic forecast made in January 2020, which did not account for the pandemic-induced recession.[2] As of 2024 Q3, the cumulative increase in real GDP since 2019 Q4 was 11.4%, 2.9 percentage points greater than predicted by CBO in January 2020. And compared to CBO’s last forecast before the pandemic, real GDP is $3.3 trillion higher (24Q3 dollars) or $9,800 per capita than expected.In addition, cumulative real GDP growth from 2022 Q4 to 2024 Q3 was 3.2 percentage points stronger than expected by CBO’s February 2023 forecast, the first projection after inflation surged.[3]
Compared to other crises, the pandemic recovery has been rapid, ushering in a robust, ongoing expansion. It took only five quarters for real GDP per capita to surpass its pre-crisis peak level, a peak-to-recovery duration much shorter than the historical experience.In comparison, following the Great Recession, real GDP per capita took 21 quarters to surpass its 2007 Q4 peak. The nature of these two recessions differs, but the swift pandemic recovery is notable given that the peak-to-trough decline in GDP in the pandemic recession was nearly double that of the Great Recession. Because the U.S. economy rebounded quickly, GDP is in its fourth year of expansion.
The U.S. economy also rebounded quickly from the pandemic recession relative to other advanced economies, with U.S. real GDP surpassing its pre-crisis level two quarters faster than the average in the remaining G7 countries. The downturn was also less severe in the United States relative to most other advanced economies, as shown by the notably shallower trough in real GDP in Figure 2.
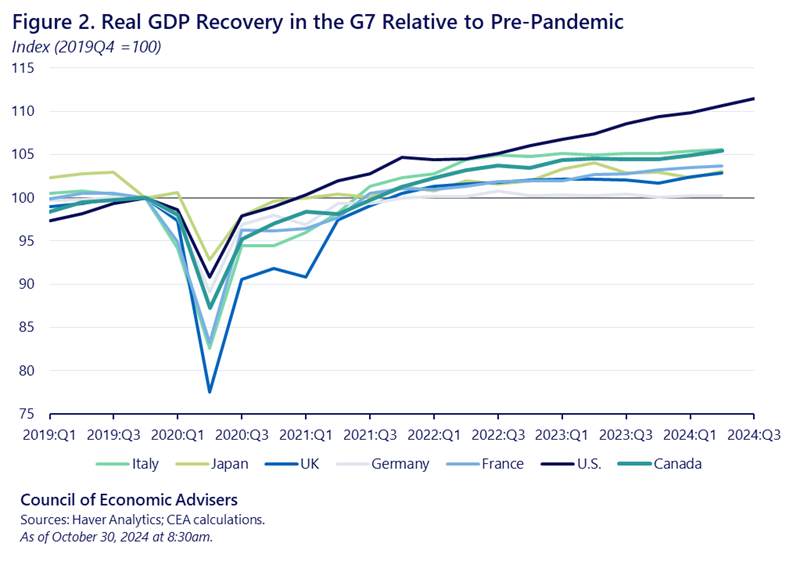
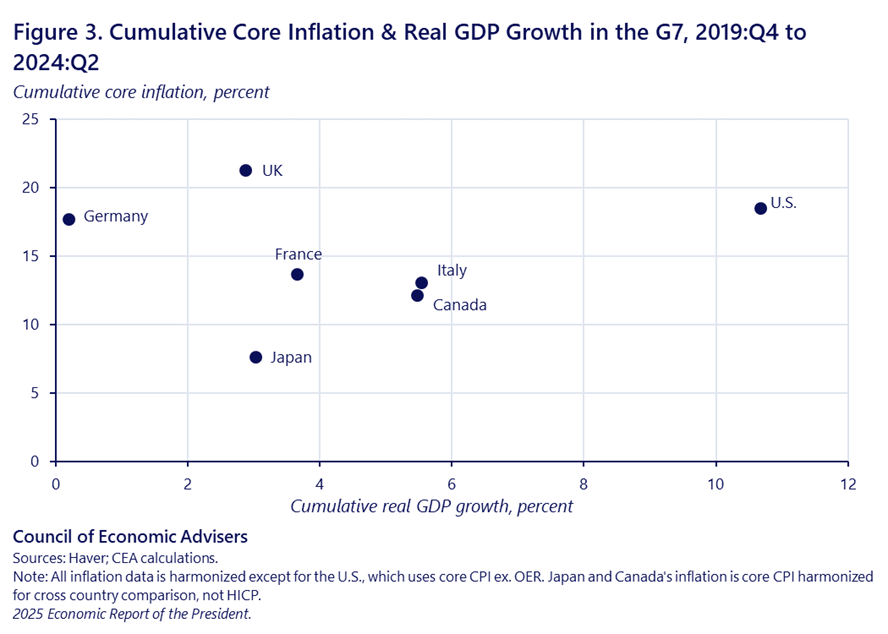
Figure 3 shows that despite U.S. real GDP growth far outpacing that of other G7 economies, the inflation experiences were very comparable. (For more on the global experience with inflation’s (nearly) roundtrip journey, see CEA Chair Jared Bernstein’s speech here.) The robust U.S. fiscal response partially explains why GDP growth was much stronger in the United States than in other advanced economies and allowed consumers to continue spending. Compositionally, consumption comprises of a relatively larger share of U.S. GDP in than in other advanced economies.
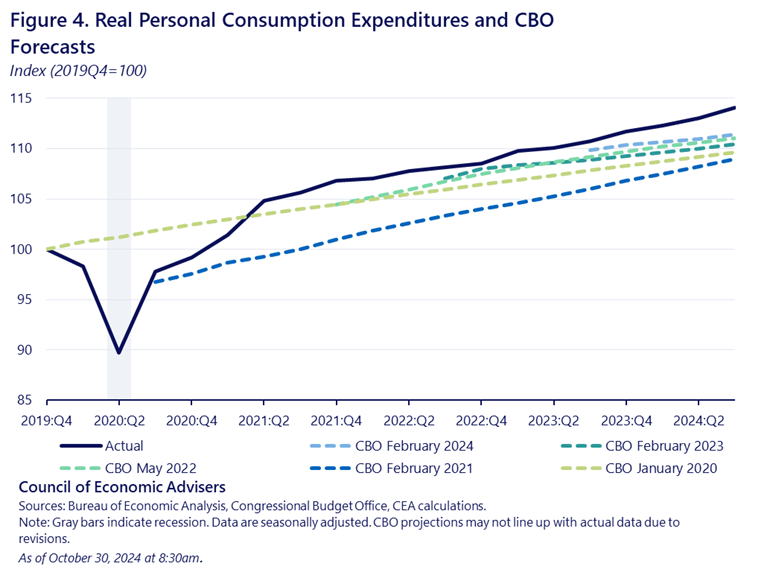
Consumer spending, which accounts for over two-thirds of U.S. GDP, has been a particularly strong driver of growth. Real consumer spending recovered to its pre-pandemic level in January 2021 and has also consistently beaten CBO forecasts. As of 2024 Q3, the level of real spending is higher than CBO projections throughout the pandemic, as well as the final pre-pandemic forecast. The cumulative growth in real consumer spending from 2019 Q4 to 2024 Q3 was 14.1%, 4.4 percentage points higher than predicted by CBO in January 2020.
Consumer spending was initially buoyed by fiscal support for households which smoothed consumption despite pandemic uncertainty. At the same time, the reduction in spending on in-person services also supported increased spending on goods. As fiscal support wound down and demand for in-person services resumed, real wage and income gains delivered by a strong labor market have helped to support spending.
Business investment (i.e., real private non-residential fixed investment) has likewise exceeded forecast expectations, as shown in figure 5. During the Biden-Harris Administration, business investment has cumulatively grown 23.0% and continued to grow at a healthy pace in 2024 Q3. This growth was partially due to investment induced by the IRA and CHIPS, with total private investment commitments nearing $1 trillion.

Public investment “crowding in” private investment explains some recent milestones. In 2024, real business investment in manufacturing structures as a contribution to real GDP growth reached a near record high as seen in figure 6. Total nominal construction spending on manufacturing has also surged, tripling between January 2021 and mid-2024.
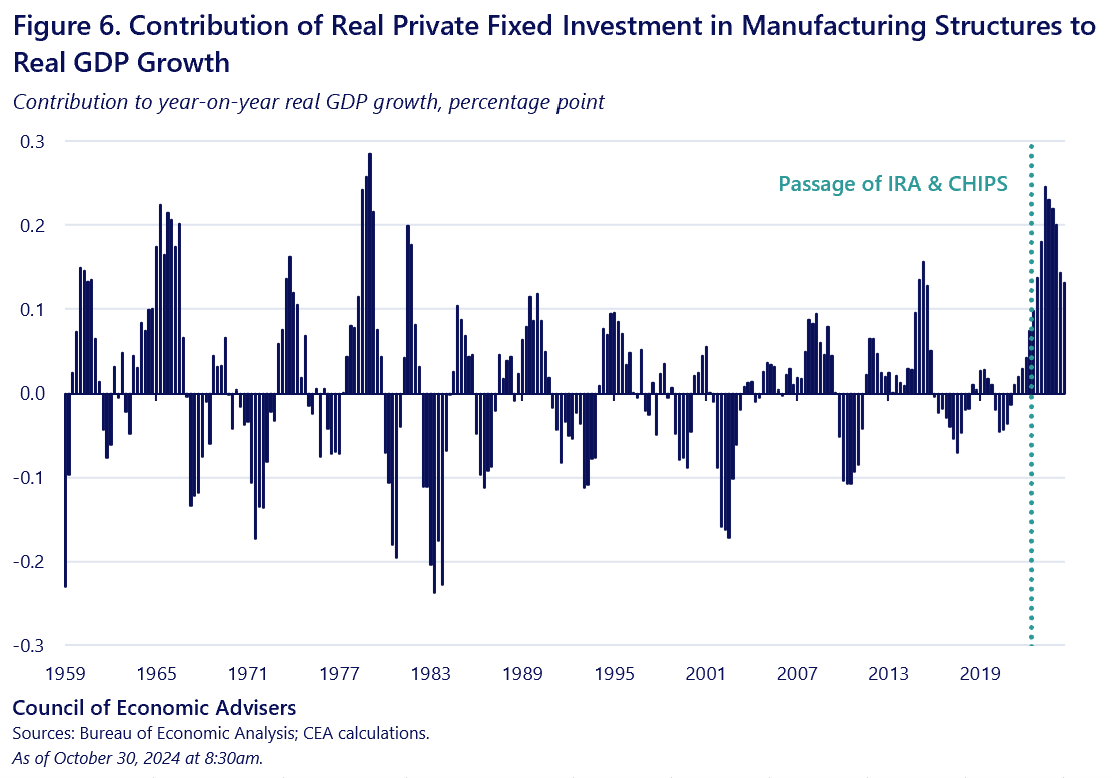
Continuing to build on this investment agenda, as well as the solid macroeconomic foundation formed over the last four years is critical to ensuring that strong, aggregate real growth persists, but equally importantly, that it continues to provide opportunities to all American households and businesses.
[1] Over the next few months BEA will publish updates to today’s report, but the first report on 2024 Q4 GDP will not be released until January 30th.
[2] CBO’s January 2020 forecast was based on data through January 7, 2020.
[3] CBO forecasts are labeled based on their release dates, but forecasts can be locked several months prior to their release. For example, the February 2023 forecast is based on data released as of December 6, 2022, while the May 2022 forecast is based on data released as of March 2, 2022. Inflation as measured by the PCE Price Index peaked in June 2022.
