Revisions Show US Economy Grew Faster, 2021–23, Boosting Real Incomes
Today, the BEA released updated estimates for GDP in the second quarter as well as their annual revision which can affect data going back several years. The report showed that GDP continued to grow at a strong pace in Q2, rising 3.0%, driven by strong consumer spending and business investment. Real GDI (gross domestic income, an alternative measure of economic output) growth was estimated to be 3.2% per quarter in the first half of the year, a large upward revision over the previous estimate of 1.3%, largely due to faster compensation growth. Over the last four quarters, real GDP growth was 3.0% and real GDI growth was 3.5%, both higher than they were a year ago. Today’s data reconfirm that the economy is continuing its strong performance, powered by a healthy labor market that is producing jobs and real income growth for American workers (see our recent blog on how the U.S. economy has defied forecasters expectations).
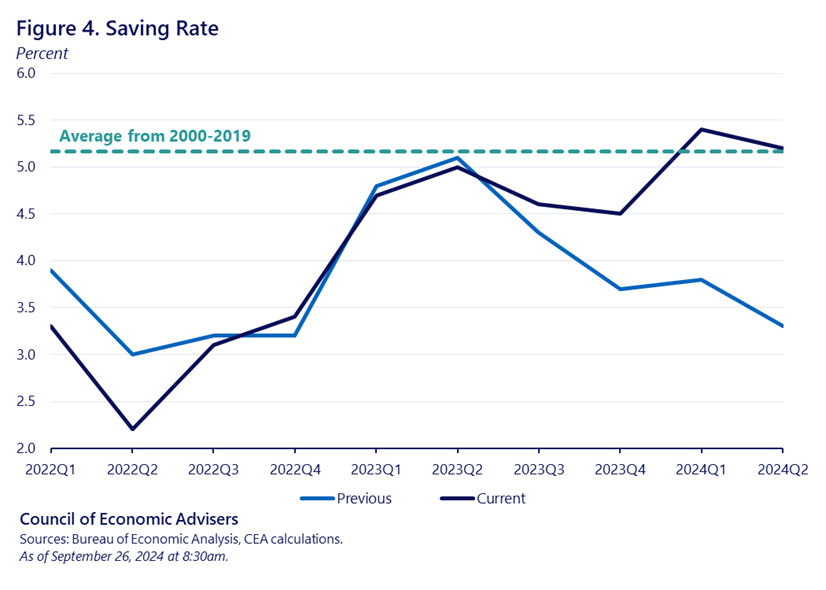
The revisions to earlier data provide an updated view on the performance of the US economy as it recovered from the COVID recession, revealing that the recovery was even stronger than previously known. Output growth is now estimated to have been higher over 2021-2023 (productivity growth—output per hour of work—is also likely to be revised up, but those data are not in this report). Further, real disposable personal income is now estimated to have grown faster since 2021, and implied that the historically low saving rate in the last quarter was substantially understated (5.2% currently vs. 3.3% previously).
The annual revisions stem from the BEA’s usual procedures of incorporating more up-to-date and comprehensive data from sources such as the Service Annual Survey from the Census Bureau, the Statistics of Income Data from the Internal Revenue Service, and more. Further details on the results of the revision and the methodology can be found here.
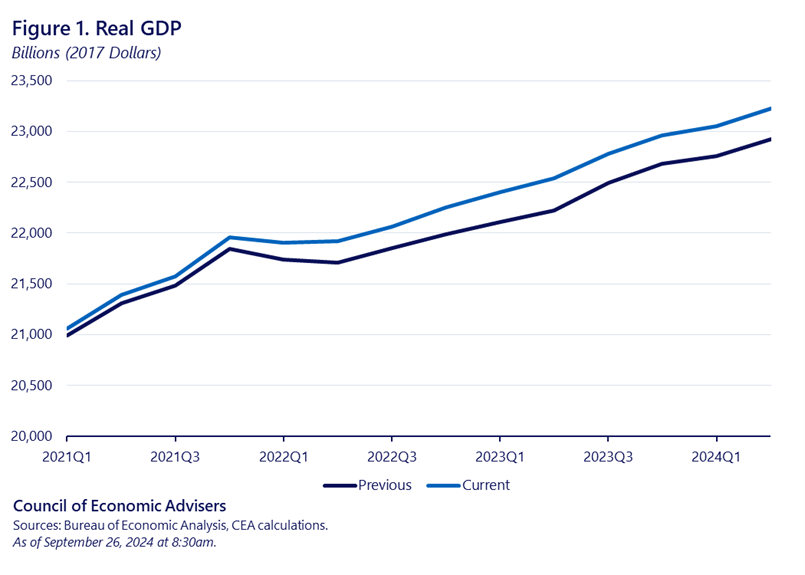
Figure 1 shows that through the end of 2023, real GDP was revised up a cumulative 1.2%, with upward revisions to growth in each 2021-2023. Real GDP was revised up a further 0.1% through 2024Q2.

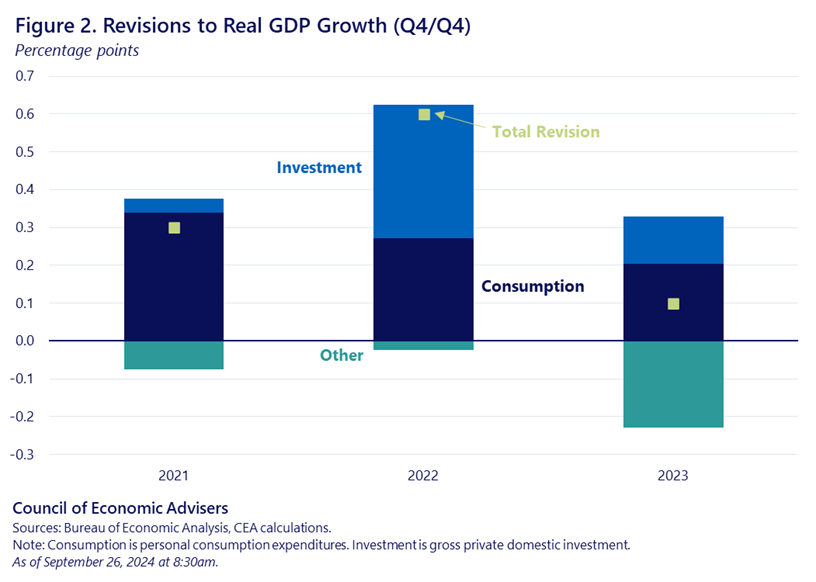
Figure 2 shows that the source of the upward revisions was mainly due to stronger consumer spending, which cumulatively (through 2023Q4) accounted for about 0.8 p.p.t. of the upward revision to real GDP (navy bars). The upward revision to consumer spending was due to stronger services spending. Another piece of the upward revision—about 0.5 p.p.t—was due to stronger business investment (blue bars), largely in factories and equipment. On the other hand, government spending and net exports were a slightly larger drag than before, especially in 2023 (combined in teal residual bars).

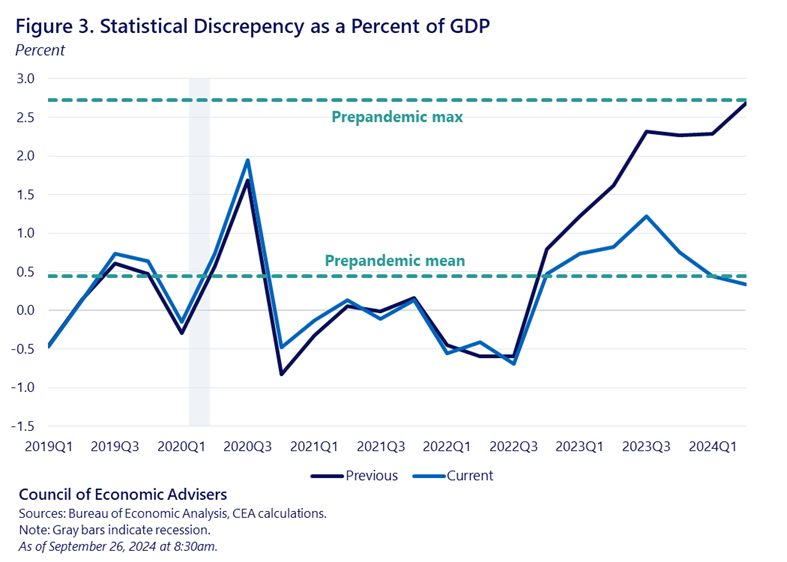
The revisions also helped to ameliorate the gap between two common measures of economic output, gross domestic product and gross domestic income. In principle, both measures should be the same according to basic macroeconomic accounting identities. In practice, though, the difference between the two, called the “statistical discrepancy” by the BEA, arises due to measurement difficulties. The statistical discrepancy increased substantially over the last two years as GDI was unusually low relative to GDP (the discrepancy was 2.7% of GDP in 2024Q2, nearly its highest on record compared with current-vintage estimates).
Some analysts worried that GDI was closer to reality over the last couple of years, suggesting the economy was not as strong as we thought. Fortunately, however, the new data show the opposite. Real GDI revised up by 3.8% cumulatively through 24Q2, even more than the upward revision to GDP (1.3%). The bulk of the upward revision was due to stronger profits in new IRS data that the BEA incorporated today. The upward revision to GDI reduced the statistical discrepancy to 0.3% of GDP in 2024Q2, as shown by the blue line in Figure 3, near its mean over pre-pandemic history.

Personal income was also revised up, primarily derived from stronger interest and dividend income, business income, and compensation (mainly in 2024Q1 and Q2). After these new data, real per capita disposable personal income excluding transfers, a measure we have pointed to, is up $3,700 from 2019Q4 (compared to $2,000 previously, both in 2024Q2 dollars) and $3,200 from 2020Q4 (compared to $1,500 before). Further, the increase in incomes boosted the saving rate from 3.3% to 5.2% in 2024Q2. This is welcome news as the saving rate had been running at historically low levels, suggesting that consumers were stretching their budgets further in recent quarters. In the revised data, the saving rate has been rising since 2022Q2 and sits right at the average of the saving rate from 2000-2019.

As President Biden spoke about last week, the current expansion has been unique in terms of maintaining strong growth amidst significant disinflation. Of course, our work is not done, in terms of lowering cost pressures and making sure all Americans benefit from this aggregate growth. But today’s revisions underscore and even amplify the President’s economic case.
