The 2023 Income, Poverty, and Health Insurance Reports: Strong household income gains, lower official poverty, uninsured rate near record low
This morning the U.S. Census Bureau released its annual reports on poverty, income, and health insurance for 2023. Here are the topline findings:
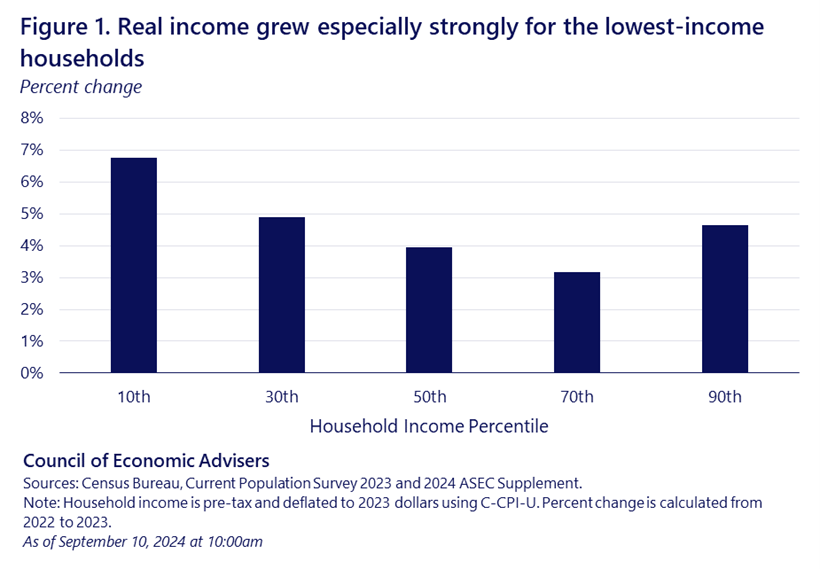
- Household income grew at a rapid pace—after adjusting for inflation—across the income distribution. Growth was strongest for the lowest-income households, but also strong at the median (4.0%).
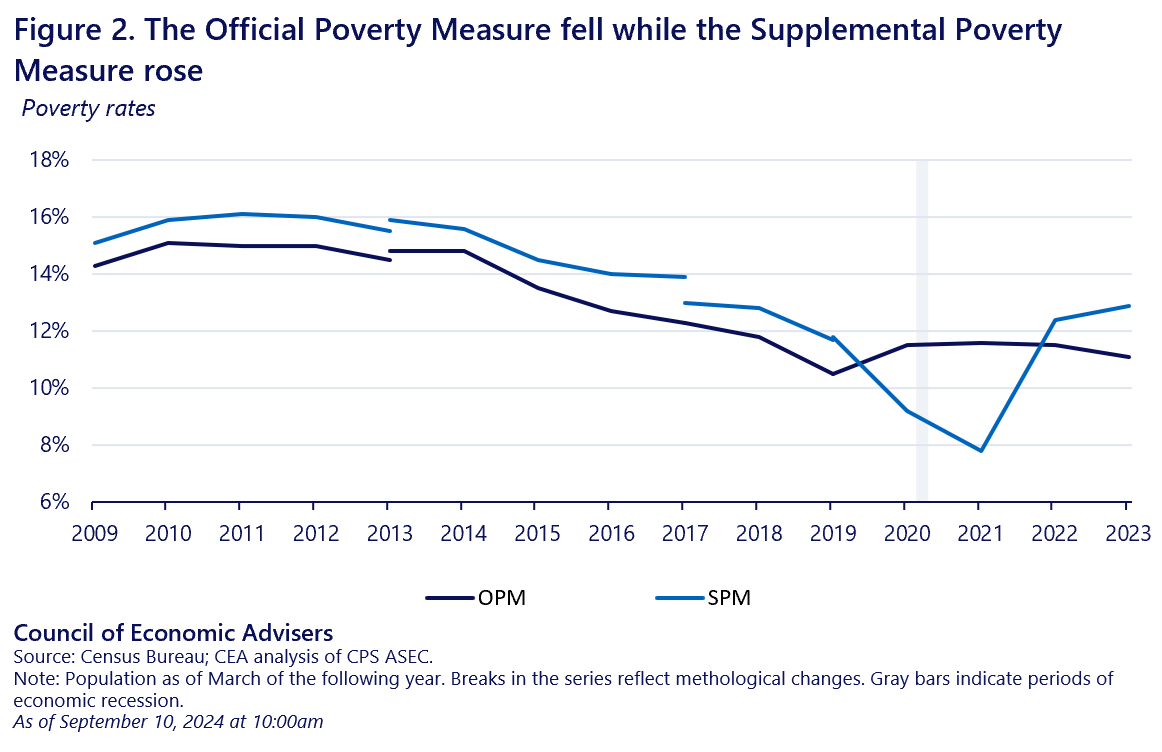
- The Official Poverty Measure (OPM) decreased by 0.4 percentage points between 2022 and 2023, falling to 11.1 percent. The Supplemental Poverty Measure (SPM), which accounts for more government benefits, taxes, and expenses than the OPM, rose from 12.4 percent in 2022 to 12.9 percent 2023.
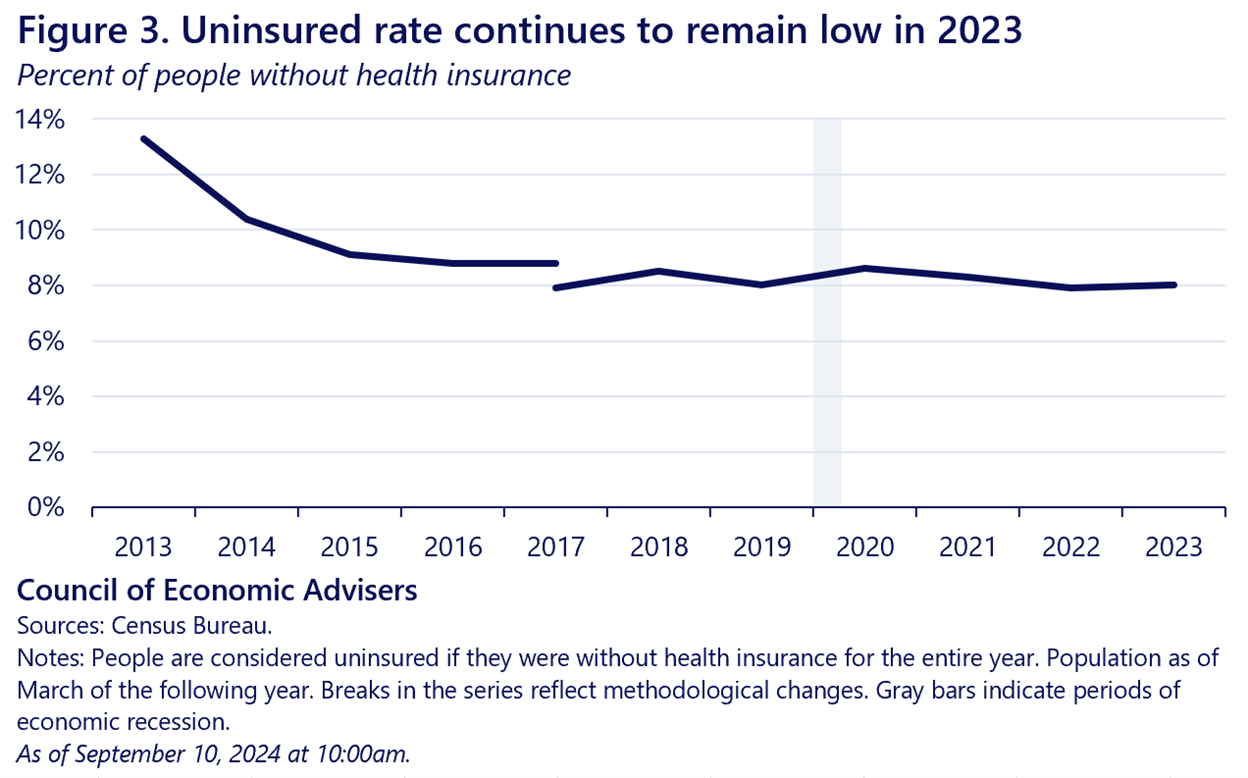
- The share of Americans without health insurance remained low at 8.0 percent in 2023, down from 8.3 percent in 2021 and similar to 7.9 percent in 2022.
Today’s report contains a clear policy message: income, poverty, and health insurance outcomes are driven not just by market outcomes, but by policy choices as well. The Affordable Care Act (ACA), along with Biden-Harris Administration actions to expand ACA health insurance, continue to be instrumental in sustaining historic reductions in the uninsured rate. The Administration’s extensions of the Child Tax Credit, which we continue to fight to reinstate, led to equally historic reductions in child poverty before it was allowed to expire. And housing policies proposed by the administration will help increase the stock of affordable rental housing, thereby lowering both housing costs and SPM poverty.
Real household income rose across the distribution
Today’s Census Bureau report confirms a pattern seen in other labor market data through 2023: real income grew robustly as inflation eased and unemployment remained historically low. CEA has long stressed how the benefits of tight labor markets disproportionately accrue to those with lower incomes, and growth last year was especially strong at lower income levels. That said, Figure 1 shows that gains from the strong labor market were broadly delivered: inflation-adjusted gains at the 10th, 30th, 50th, 70th, and 90th percentiles were all above 3%. The ratio of the 90th to 10th percentiles fell from 12.63 to 12.38, indicating relative gains for low-income households, and delivering the lowest level of income inequality since 2015. Growth at the bottom of the income distribution—6.7% for households at the 10th percentile, after adjusting for inflation—drove the decline in the official poverty rate and helped mitigate the increase in SPM poverty. It also produced an all-time high in the 10th percentile of household income.
These real growth rates for lower-income households are historically large but consistent with what we have tended to see in periods of tight labor markets. For 10th percentile households, the three largest annual increases occurred in 2019, 2015, and 1968.

Reduction in income inequality was also evident across the educational distribution. Median income rose 4.3% when the householder has only a high school degree, versus 3.1% for those with a four-year degree or more.1 And rural households did better (7.5%) than their counterparts within metropolitan areas (3.7%).
Median incomes rose in each region of the country and for every racial/ethnic group measured by the Census, with the exception of Asian households. Black, Hispanic, and White non-Hispanic households experienced real income increases of 2.8%, 0.4%, and 5.7%, respectively (Asian households’ incomes declined only slightly). For the median Black household, inflation-adjusted income is now at an all-time high.
Table 1 below shows income changes for each of these racial/ethnic groups since 2020. Relative to that year, median incomes rose in real terms for Asian, Black, Hispanic, and White non-Hispanic households. Increases ranged from $700 for Hispanic households (1.1%) to $2,650 for Black households (4.9%).

The official poverty rate fell, but the supplemental poverty rate rose
The official poverty rate, which reflects only the inflation-adjusted changes in income described above, fell from 11.5% in 2022 to 11.1% in 2023. However, the rate of poverty in the supplemental measure rose from 12.4% to 12.9%. Figure 2 shows these trends.
Why did the SPM rise while the OPM fell? One answer is that the inflation index used for the SPM puts substantially more weight on housing than does the more commonly used CPI-U. SPM poverty thresholds were therefore driven higher by housing inflation in 2023. In addition, some of the increase in SPM thresholds were caused by shifting pandemic-era consumption patterns. Researchers have tried to disentangle these by using a so-called anchored measure of SPM that only takes account of inflation. These anchored measures show flat or falling SPM poverty rates, depending on the choice of inflation index.
Pandemic-era benefit expiration elevates child poverty
While the SPM poverty rate increased by 0.5 percentage points, the child SPM poverty rate increased by more than double the overall SPM rate. In 2023, SPM child poverty reached 13.7 percent, up 1.3 percentage points from 12.4 percent in 2022 and up 8.5 percentage points from 5.2 percent in 2021. However, as CEA noted last year, the increase in child poverty since 2021 is a predictable consequence of failing to extend the enhanced Child Tax Credit (CTC), a policy the Biden/Harris administration continues to fight for. In 2021, the enhanced CTC lifted almost 3 million children out of SPM poverty (compared to about 1.4 million children in 2023) and cut the child SPM poverty rate by more than 40 percent. In 2021, the enhanced CTC lifted almost 3 million children out of SPM poverty (compared to about 1.4 million children in 2023) and cut the child SPM poverty rate by more than 40 percent.

The Biden-Harris Administration has consistently advocated for a permanent enhanced CTC to help reduce child poverty. If the enhanced CTC had been available in 2023 and had the same effect on SPM child poverty as in 2021, reducing the SPM child poverty rate by 40 percent, the SPM child poverty rate would have been 9.4 percent, about 4.3 percentage points lower than what Census reported. Continued opposition to the expansion of the enhanced CTC unnecessarily keeps millions of children in poverty, generating substantial, well-documented negative consequences. A review by the National Academies of Sciences finds that there is “overwhelming evidence” that children who grow up in poverty have worse outcomes along a variety of dimensions of success.
In an effort to offset part of the loss of the enhanced CTC, the Biden-Harris Administration led an effort that resulted in the creation of Summer Electronic Benefits Transfer (EBT), referred to as SUN Bucks. Beginning in 2024, SUN Bucks, which will be a continuation of the Pandemic Electronic Benefits Transfer (P-EBT), provides $120 per eligible child during the summer to help families afford groceries, and is aimed at the millions of children that receive free or subsidized school meals. Summer food assistance has been shown to reduce food insecurity, and food assistance, more generally, has been shown to have positive effects on economic outcomes.
Rising housing costs contributed to higher SPM thresholds
Poverty rates are determined not just by changing income and policies, but also by shifts in the income thresholds that determine who is poor. Rising costs have increased the number of people with incomes below the SPM thresholds, particularly among those who rent their homes. SPM thresholds are calculated separately for renters, owners with a mortgage, and owners without a mortgage (more detail is available in the appendix). While all the thresholds increased by more than usual between 2022 and 2023, renters experienced the largest increase.
Reducing the cost of housing is therefore crucial to reducing SPM poverty. The Biden-Harris Administration has advocated for various policies to help reduce the increase in rents and increase the supply of affordable housing, many of which require Congressional support. For example, we have launched an all-of-government Housing Supply Action Plan to increase the stock of affordable housing by millions of units. This far-reaching plan includes $185 million in grants for communities to reduce barriers to housing construction, improvements to the Low Income Housing Tax Credit (a credit supporting affordable multifamily housing, a key source of pressure of the SPM threshold), updating HUD rules so that more types of housing can be built efficiently under HUD code, and a Legacy Challenge to encourage communities to use Community Development Block Grants for transformative housing investments, and more.
Health insurance coverage remained high in 2023
The uninsured rate (share of people without health insurance for the entire year) continued to remain low in 2023 at 8.0 percent, statistically indistinguishable from 2022’s 7.9 percent rate. Although Census has made changes over time in how health insurance coverage is measured, the uninsured rate in 2023 is among the lowest achieved under the newer measurement system (see Figure 3)dating back to 2017. This gain in insurance coverage builds on the earlier success of the ACA, with a fall in the uninsured rate from 13.3 percent in 2013 (before the ACA insurance expansions) to 8.8 percent in 2016 (after the ACA insurance expansions).

Uninsured rates differ by demographic characteristics, including race and ethnicity. In 2023, uninsured rates reached the lowest rates on record for Black and Asian people at 8.1 percent and 5.5 percent, respectively. The uninsured rate for white, non-Hispanic people increased by 0.1 percentage point to 5.0 percent, while the uninsured rate for Hispanic people increased 0.3 percentage point to 17.5 percent in 2023.
Census also provides information on the uninsured rate by age group. Children under age 19 experienced a 0.5 percentage point increase in their uninsured rate at 5.8 percent in 2023.2 Additional information provided by Census on the source of insurance coverage indicates that this change was accompanied by a decline in the share of children with employer-based health insurance for some or all of the year from 55.0 percent in 2022 to 54.0 percent in 2023.
The record highs for insurance coverage in recent years reflect the focus of the Biden-Harris Administration on increasing the availability and affordability of health insurance coverage. Effective in 2023, administrative action removed the “family glitch” to expand financial assistance for the purchase of Affordable Care Act (ACA) health insurance coverage to many families who were previously ineligible.3 This follows other changes to increase the generosity of financial assistance for ACA coverage, facilitate state Medicaid expansions, and invest in enrollment outreach in recent years.
Gains in insurance coverage also reflect continuous Medicaid enrollment under a pandemic-related provision that ended in March 2023. The uninsured rate in 2023 does not yet tell us the results of the “unwinding” of this provision, since affected individuals had coverage at the beginning of the year. However, proactive steps have been taken by the Biden-Harris Administration to aid the eligibility redetermination process for states and help transitions to other sources of coverage for people no longer eligible for Medicaid.
New Biden-Harris administration policies also aim to further expand and protect coverage for children. A new change that started on January 1, 2024 requires that all states provide 12 months of continuous eligibility for children enrolled in Medicaid and the Children’s Health Insurance Program (CHIP). Continuous eligibility policies are associated with higher rates of insurance coverage, reduced gaps in coverage, and better health among children. In addition, a final rule issued in March 2024 took additional steps to make it easier for Americans, including children, to apply for and renew health insurance coverage under Medicaid and CHIP.
APPENDIX
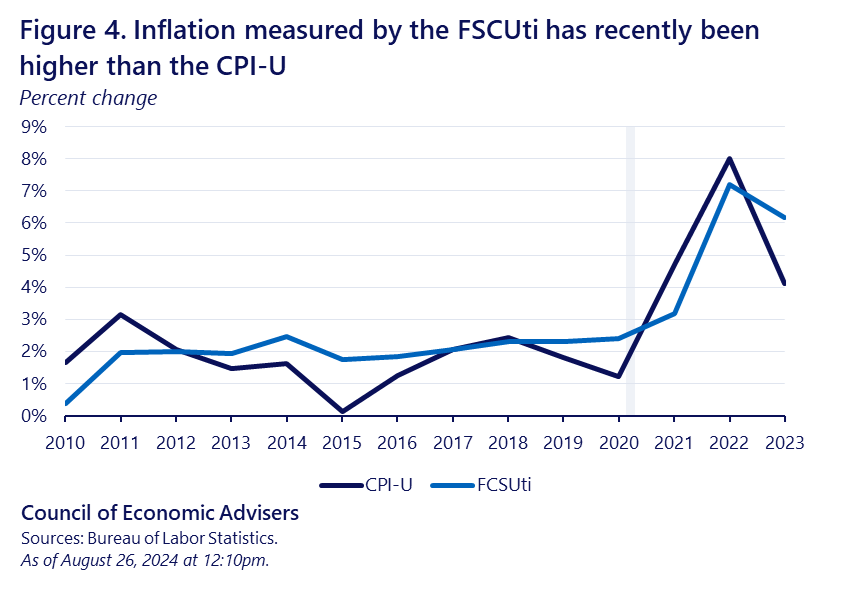
Each year, the Bureau of Labor Statistics (BLS) calculates the SPM thresholds using the Consumer Expenditure Survey data on out-of-pocket spending by consumer units in the middle of the out-of-pocket spending distribution, between the 47th and the 53rd percentiles, from the previous five years. Because the data used to calculate the SPM thresholds are based on a specific basket of goods and services, BLS uses an inflation index for food, clothing, shelter, and utilities (FCSUti) rather than the more-familiar CPI-U.4 In 2023, the FCSUti remained elevated in comparison to the CPI-U and prior increases (see Figure 4). A 2023 study by the Bureau of Labor Statistics showed that the inflation adjustment was the primary driver of the increase in the SPM thresholds from 2021 to 2022. While the increase in the 2023 SPM thresholds (6.8 percent for homeowners without a mortgage, 7.8 percent for homeowners with a mortgage, and 8.6 percent for renters) was smaller than the 2022 change from 2021, the increase still outpaced the two to four percent increase of 2016 to 2021. Given that the FCSUti index remained elevated again in 2023, inflation is likely to be a large contributor to the increase.

- The Census Bureau defines a “householder” as “the person (or one of the people) in whose name the home is owned or rented and the person to whom the relationship of other household members is recorded.” ↩︎
- Working age adults saw no significant change and adults age 65 and older saw a decrease of 0.2 percentage points to 0.9 percent in 2023. ↩︎
- Previously, if an employee was offered affordable employee-level coverage but not affordable family-level coverage from their employer, their family members were ineligible for financial assistance for ACA health insurance coverage. ↩︎
- Prior to 2020, the index used to adjust the thresholds included telephone services and excluded internet and in-kind transfers. ↩︎
