Both sides now: The importance of analyzing price and income growth
Today’s personal income data showed that inflation continued to ease in July, while the American consumer remains in good shape. Core PCE price inflation was 0.2% in July, as expected, and 2.5% over the year, a tick below expectations and down from 3.3% a year ago. Inflation-adjusted consumer spending was up a solid 0.4% in July and 2.7% over the past year. Real disposable personal income is up 1.1% over the past year, reflecting in part the ongoing strength of the U.S. labor market. See CEA’s X thread for more information on the today’s data.
While these nearer-term measures are informative regarding the current trends in inflation and spending, it is also contextually useful to step back and assess how American households have fared over the last several years. Given the plethora of indicators of financial well-being, measuring how people are doing in one time period compared to a later time period invokes many different choices. We can look at standard measures such as incomes, wages, wealth, or the number of jobs. But even with those standard indicators, choices abound. If we want to track labor market income—by far the dominant source of income for most working-age families—are we talking about hourly wages or some broader measure of earnings that accounts for hours worked?[1] Further, to compare points over time, one must account for important measurement issues such as composition shifts in the workforce that affect average wages and short-duration spikes due to transfers or other emergency programs implemented during COVID.
Another benefit of this analysis is that it underscores the fact that we cannot assess how living standards are faring by looking only at price changes. We must jointly evaluate changes from both sides of the family ledger: prices and incomes.
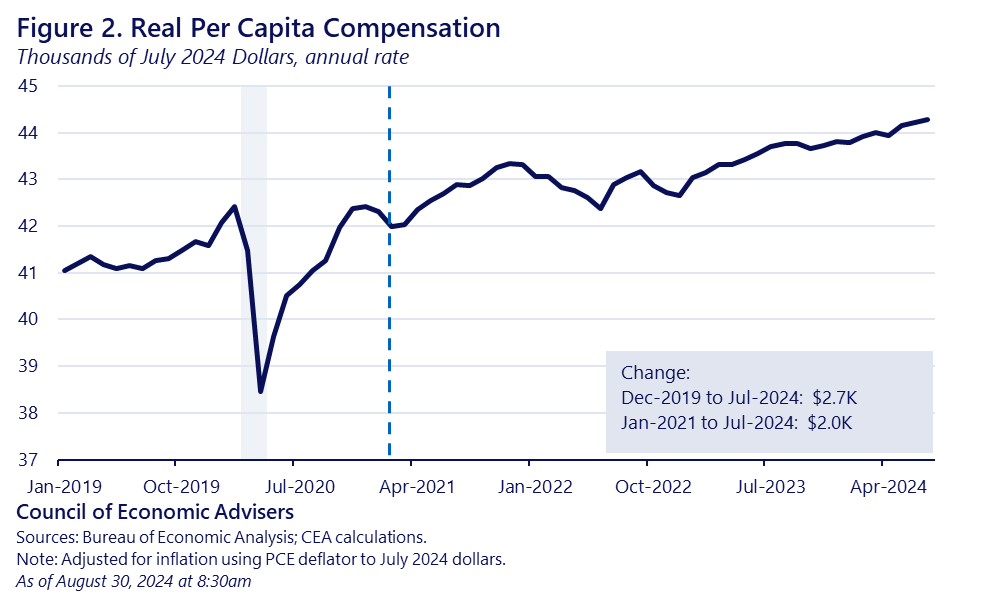
In so doing, we find that real compensation and incomes are up over the longer-term for American households. On a per-capita basis, from January 2021 to July 2024, real compensation, which includes the impact of both wage and job growth, is up 4.6% ($2,000) and real incomes, after taxes but before transfers, are up 4.9% ($2,300).[2]
Details
A commonly used metric for assessing economic well-being is inflation-adjusted incomes after-tax, and post-transfers per person (known as per capita disposable personal income, DPI in the BEA accounts). However, using this common measure to assess income trends in the period around COVID raises a measurement challenge: the various rounds of pandemic-era government transfers added large spikes to the data series. For example, in March 2021 alone, a round of stimulus checks passed by President Biden in the American Rescue Plan added about $12,200 to per capita DPI (annual rate). If we measure a trend from a month that includes temporary pandemic assistance to one that does not, it will appear as though real incomes are trending down, because as monthly income goes from a temporary high point back to a more normal point. However, real DPI per capita increased by 6.6%, or $3,800, from prior to COVID (December 2019) to July 2024.
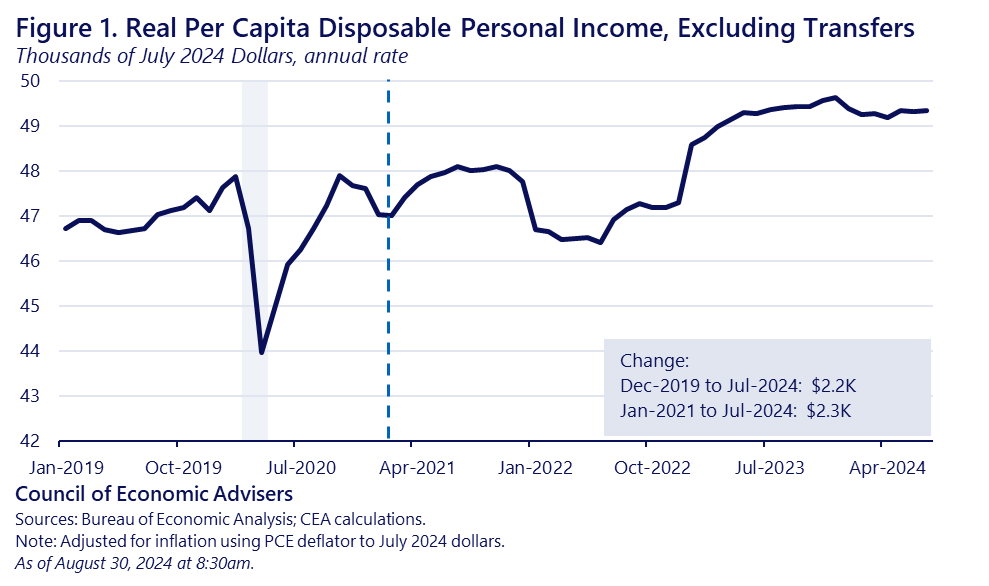
Another way to avoid the spike in transfers is to take them out of the DPI data, as in the figure below. This measure tracks real, after-tax income, including labor earnings and other forms of market incomes (interest, dividends, rents), but takes out the contribution to income from government transfers, like unemployment insurance or Social Security benefits. In this sense, it allows us to assess how market-generated incomes have progressed without the spikes. By this measure, income per capita is up between about $2,200 to $2,300 (or 4.7-4.9%), depending on the starting point.

The next figure helps to control for this composition bias by measuring real compensation relative to the number of people, rather than workers, to avoid the sharp changes in the denominator (number of workers) during COVID. We can think of this as measuring how much real purchasing power the labor market is providing the people over time, and it shows real growth of $2,000 per person from January 2021.

While these measures show various ways to look at income gains, another approach is to compare the change in people’s nominal incomes to the costs they face when buying the goods and services they want and need. Republicans on the Joint Economic Committee (JEC-Rs) have calculated the second half of that equation, i.e., the price increase in a fixed market basket of goods per consumer unit (a concept similar to households), and reported that this cost has gone up by thousands of dollars since 2021. However, JEC Democrats correctly add back in the first part of the equation: how much did nominal incomes rise? The JEC-Ds find that while both costs and incomes—in this case, incomes per consumer unit—rose since President Biden took office, incomes are up $3,776 more than costs.
In conclusion, we’d expect real wages and incomes to rise in a robust recovery characterized by persistently tight labor markets and declining inflation. The data show that this has, in fact, occurred. But, data issues, such as spikes in incomes due to pandemic-era transfers, must be taken into account. Of all the measures we present, we think the $2,300 increase in real per capita disposable income, ex-transfers, best represents the real income gains since January 2021.
Of course, our work is not done and we know many households continue to struggle with high prices. But these data confirm we’ve been moving in the right direction and we will thus continue to fight to maintain and build on the gains documented herein, while working equally hard to lower inflation and costs.
[1] Another question is which deflator to use to inflation-adjust the various series we show. As the agencies themselves generally do, we use the PCE deflator from these BEA series.
[2] Our analysis is consistent with a recent analysis from the Joint Economic Committee which shows that incomes have increased nearly $3,800 more than costs for American consumers since 2021.
