Chain Reaction: “Immaculate” Disinflation and the Role of Easing Supply Chains
One of the most important and interesting trends in current macroeconomics, one to which President Biden has often referred, is the fact that, contrary to conventional macroeconomic models, inflation has fallen while unemployment has stayed historically low. Headline Consumer Price Index (CPI) inflation has fallen 5.9 percentage points—to 3.2 percent in the most recent release from 9.1 percent last June—while core inflation has fallen a lesser amount, by 1.9 percentage points. The comparable declines for the Personal Consumption Expenditures (PCE) Price Index are 4.0 for headline and 1.3 for core.[1]
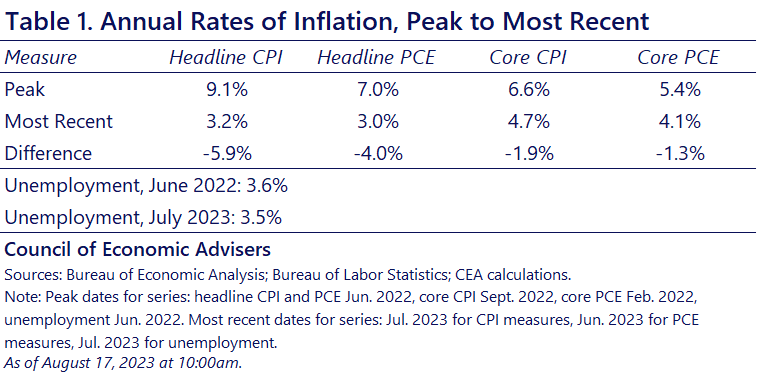
Remarkably, as this disinflation has occurred, the unemployment rate has hardly budged. When the CPI inflation rate peaked in June 2022, the unemployment rate was 3.6 percent. Last month, in July 2023, it was slightly lower, at 3.5 percent.
This is surprising because a long-held conventional view among many economists is that unemployment and inflation move in opposite directions: if one goes up, the other should go down, a trade-off referred to as the “sacrifice ratio.” Yet over the last 12 months, when inflation has been falling and the unemployment rate has been flat, there has been no trade-off; the sacrifice ratio has been zero. This is why some economists have termed this recent behavior “immaculate” disinflation.
The CEA, however, sees little that is “immaculate” about the disinflation that has thus far transpired. The sacrifice ratio framework (also known as the price Phillips Curve) inherently emphasizes the economy’s demand-side, but part of what drove inflation up in the first place was disruptions to the economy’s supply side (strong demand also played a role).
As this post shows, part of what is driving inflation back down is the unsnarling of formerly snarled supply chains. Of course, supply chain normalization is but one of the relevant dynamics in the current economy. There has been some cooling of the labor market that shows up in other measures besides unemployment (e.g., fewer unfilled job openings), and the sharp growth of prime-age labor supply has also been an important factor in play. Moreover, as the levels in July 2023 inflation rates in table 1 show, disinflation is still a work in progress. As the President says, our work is not over in this regard.
Supply chain improvements and their impact on inflation
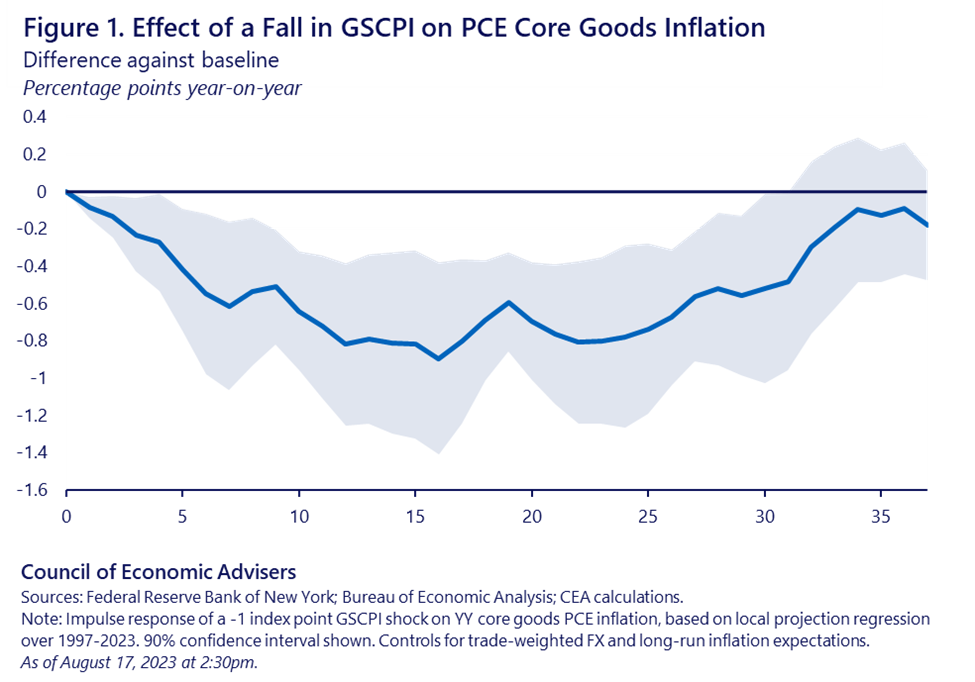
When bottlenecked supply chains begin to unsnarl, goods prices can rise more slowly or even fall outright for some products. This effect on goods inflation is surprisingly persistent. The chart below shows the effect over time of a sudden fall in the New York Federal Reserve’s Global Supply Chain Pressure Index (GSCPI), a summary measure of supply-side bottlenecks. When the GSCPI falls one index point, indicating less pressure on supply chains, core goods inflation declines and then generally remains more than half a percentage point lower even two years later.
In June, the CEA released a blog showing how unsnarled supply chains are helping ease goods inflation and these trends appear to be continuing throughout the summer. These improvements reflect, in part, efforts initiated by President Biden shortly after taking office, including launching a task force partnered with the private sector to move record levels of cargo through the ports while lowering shipping and rail costs (see here for a scorecard of this work).
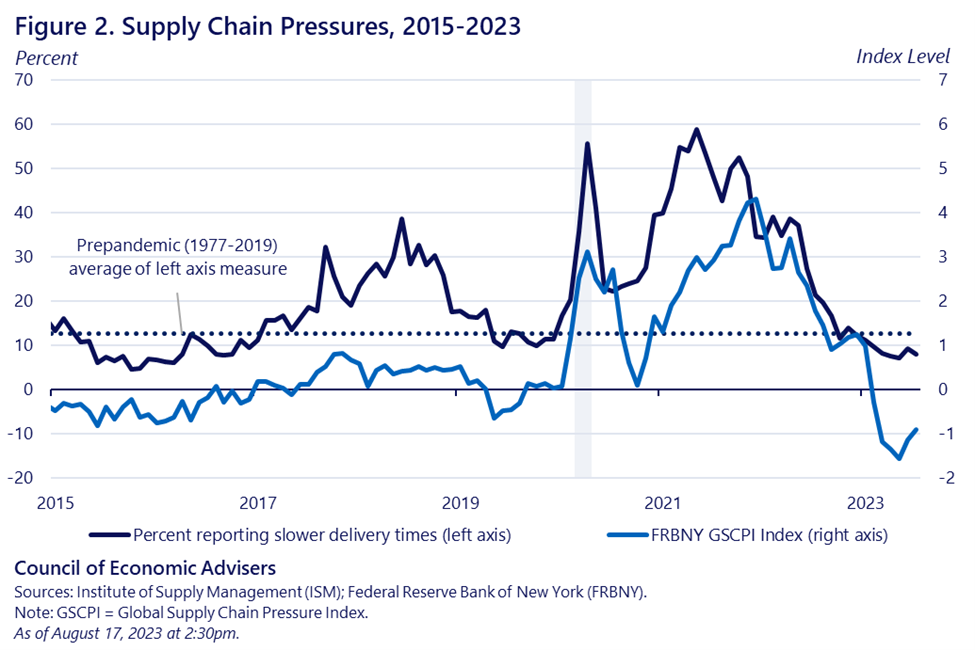
Figure 2 shows that the share of business respondents reporting slower delivery times in the Institute of Supply Managers (ISM) survey has continued to decline, as has the GSCPI.
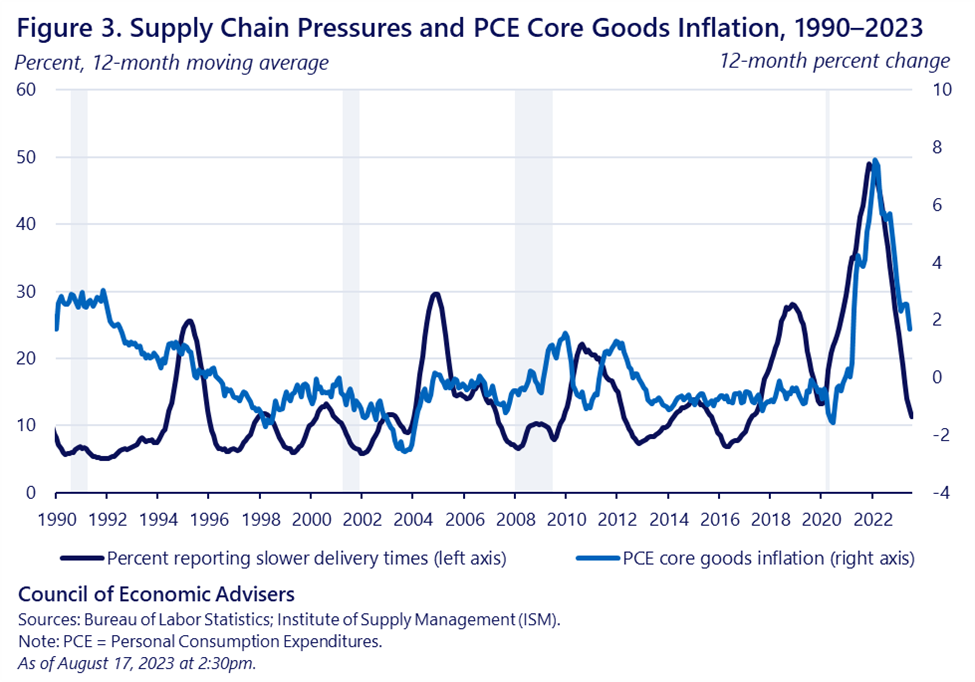
A similar comparison, shown in Figure 3, between supplier delivery times and the PCE for core goods shows a downward trend since 2022, consistent with the findings in Figure 1. Reduced stress in supply chains is likely helping to ease pressure on the prices of various consumer goods.
Whether the future holds more of a trade-off between economic activity and lower inflation is to be seen. A trade-off between inflation and the unemployment rate could still emerge, leading the sacrifice ratio to rise. Thus far, however, as the factors delineated above—improved supply chains, greater labor supply, some labor market cooling—have helped to ease inflationary pressures, the persistently tight labor market has helped to fuel wage gains that are now beating inflation, more so for middle- and low-wage workers who often depend on a tight labor market as a source of bargaining power.
These real wage gains, in turn, continue to support robust consumer spending, as seen most recently in this week’s stronger than expected retail sales report. We see nothing particularly magical or immaculate about any of these developments, and our goal is to continue working to further ease supply-side pressures while maintaining the historically tight labor markets.
Appendix
The table below illustrates changes in inflation if a 3-month annualized average is taken for each series.
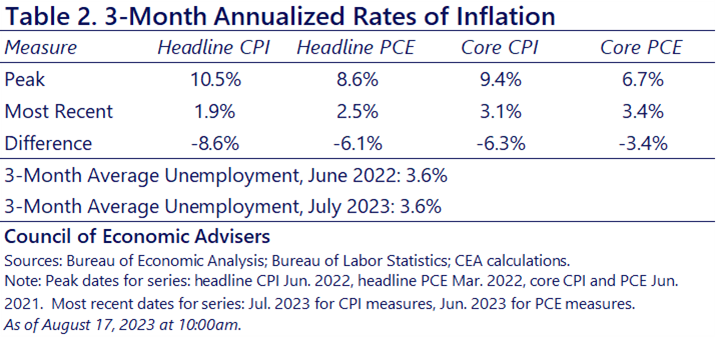
[1] This disinflation has been steeper using three-month annualized rates, as shown in an appendix table. The CEA has argued that these rates provide a more up-to-date take on inflation’s recent trend.
