FACT SHEET: President Biden’s Cap on the Cost of Insulin Could Benefit Millions of Americans in All 50 States
As part of President Biden’s historic Inflation Reduction Act, nearly four million seniors on Medicare with diabetes started to see their insulin costs capped at $35 per month this past January, saving some seniors hundreds of dollars for a month’s supply. But in his State of the Union, President Biden made clear that this life-saving benefit should apply to everyone, not just Medicare beneficiaries.
This week, Eli Lilly, the largest manufacturer of insulin in the United States is lowering their prices and meeting that call.
Eli Lilly announced they are lowering the cost of insulin by 70% and capping what patients pay out-of-pocket for insulin at $35. This action, driven by the momentum from the Inflation Reduction Act, could benefit millions of Americans with diabetes in all fifty states and U.S. territories. The President continues to call on Congress to finish the job and cap costs at $35 for all Americans.
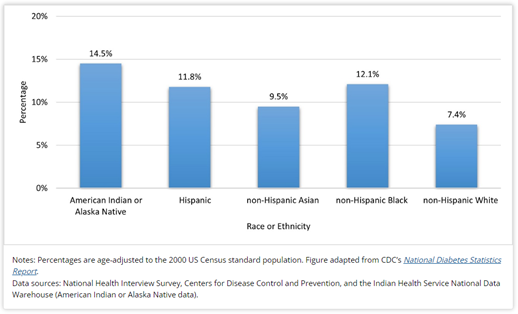
The below data breaks down how many adults are living with diabetes in each state, highlighting the cumulative number of adults that could experience lower insulin costs from the Inflation Reduction Act’s insulin cost cap for seniors, and industry’s follow-on actions. And, data shows that these cost-saving measures will disproportionately impact communities of color, as Black, Hispanic, and American
Indian/Alaska Native adults have higher rates of diabetes in the United States than white Americans.
Additional information on how many seniors in each state are already benefiting from the President’s historic actions is available here from the Department of Health and Human Services.
Percentage of Adults Aged 18 Years or Older with Diagnosed Diabetes, by Racial or Ethnic Group, United States, 2018-2019


*The estimates are developed from a base that incorporates the 2020 Census, Vintage 2020 estimates, and (for the U.S. only) 2020 Demographic Analysis estimates. The estimates add births to, subtract deaths from, and add net migration to the April 1, 2020 estimates base. For population estimates methodology statements, see https://www.census.gov/programs-surveys/popest/technical-documentation/methodology.html. See Geographic Terms and Definitions at https://www.census.gov/programs-surveys/popest/guidance-geographies/terms-and-definitions.html for a list of the states that are included in each region. All geographic boundaries for the 2022 population estimates series are as of January 1, 2022.
###
